


2023 E 3rd Ave Denver, CO 80206
Country Club NeighborhoodEstimated payment $14,804/month
Highlights
- Wine Cellar
- The property is located in a historic district
- Open Floorplan
- Bromwell Elementary School Rated A-
- Primary Bedroom Suite
- Deck
About This Home
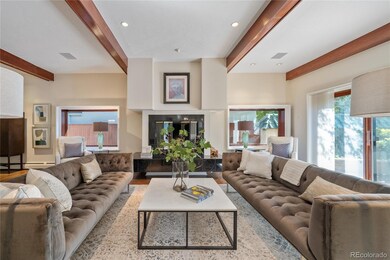
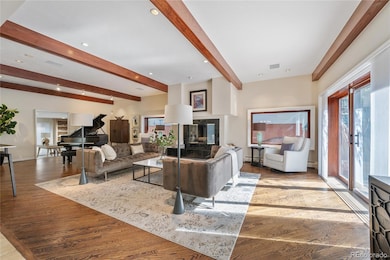
Elegance and warmth are the hallmarks of this this iconic contemporary Denver Country Club home. A gated hidden gem tucked behind high privacy walls, it was designed with a tranquil Japanese style exterior by noted architect, Ken Taniguchi. The interior, a wonderful flow of spacious and stylish rooms. Incredibly quiet and secluded feeling, yet it sits just a heartbeat away from Cherry Creek’s premier dining, boutiques, and art galleries. This truly top-notch location suggests a perfect Cherry Creek alternative, just out of the fray. As you enter through the charming enclosed courtyard, you're greeted by graceful contemporary architecture and large comfortable spaces creating gorgeous settings for entertaining and daily living. A serene and welcoming Foyer opens to expansive Living and Dining Rooms, flowing to a wonderful chef's Kitchen with five burner gas range, large pantry, and exquisite custom cabinetry. A perfect private office with a bar, and a delightful Library/Den for relaxing complete the first level. Upstairs, a grand, sunny, and zen-like Primary Suite, and a second Bedroom Suite, both with private decks and incredible custom walk-in closets. Skylights and large windows fill every room with natural light, enhancing the home’s calming energy. Downstairs, a marvelous Family/Entertainment Room, mirrored Exercise Room, and impressive Wine Room add everything you could wish for in a home. Outdoors, discover a magical secret garden, peaceful patios, and multiple decks designed for intimate gatherings and quiet reflection, without the upkeep of a yard. With its imported Japanese porcelain tile roof, rich hardwood floors, and new carpet and paint throughout, this residence is a remarkable balance of aesthetic beauty, privacy, and livable sophistication. A rare and extraordinary opportunity in one of Denver’s most coveted neighborhoods.
Listing Agent
Kentwood Real Estate Cherry Creek Brokerage Email: juliewinger@kentwood.com,303-946-2784 License #040024736 Listed on: 10/29/2025

Home Details
Home Type
- Single Family
Est. Annual Taxes
- $13,824
Year Built
- Built in 1988
Lot Details
- 4,120 Sq Ft Lot
- South Facing Home
- Property is Fully Fenced
- Landscaped
- Secluded Lot
- Level Lot
- Front Yard Sprinklers
- Many Trees
- Garden
- Property is zoned E-SU-D
Parking
- 2 Car Attached Garage
- Parking Storage or Cabinetry
- Lighted Parking
Home Design
- Traditional Architecture
- Stucco
Interior Spaces
- 2-Story Property
- Open Floorplan
- Sound System
- Built-In Features
- Vaulted Ceiling
- Ceiling Fan
- Skylights
- Wood Burning Fireplace
- Gas Fireplace
- Double Pane Windows
- Window Treatments
- Entrance Foyer
- Smart Doorbell
- Wine Cellar
- Family Room with Fireplace
- 2 Fireplaces
- Living Room with Fireplace
- Dining Room
- Home Office
- Utility Room
- Home Gym
Kitchen
- Eat-In Kitchen
- Self-Cleaning Oven
- Range with Range Hood
- Microwave
- Dishwasher
- Wine Cooler
- Kitchen Island
- Marble Countertops
- Granite Countertops
- Disposal
Flooring
- Wood
- Carpet
- Stone
- Tile
Bedrooms and Bathrooms
- 2 Bedrooms
- Primary Bedroom Suite
- En-Suite Bathroom
- Walk-In Closet
- Spa Bath
Laundry
- Laundry Room
- Dryer
- Washer
Finished Basement
- Partial Basement
- Sump Pump
- Basement Window Egress
Home Security
- Home Security System
- Fire and Smoke Detector
Eco-Friendly Details
- Smoke Free Home
Outdoor Features
- Balcony
- Deck
- Patio
- Outdoor Water Feature
- Exterior Lighting
Location
- Property is near public transit
- The property is located in a historic district
Schools
- Bromwell Elementary School
- Morey Middle School
- East High School
Utilities
- Evaporated cooling system
- Heating System Uses Natural Gas
- Gas Water Heater
Community Details
- No Home Owners Association
- Denver Country Club Subdivision
Listing and Financial Details
- Exclusions: All staging items
- Property held in a trust
- Assessor Parcel Number 5111-23-016
Map
Home Values in the Area
Average Home Value in this Area
Tax History
| Year | Tax Paid | Tax Assessment Tax Assessment Total Assessment is a certain percentage of the fair market value that is determined by local assessors to be the total taxable value of land and additions on the property. | Land | Improvement |
|---|---|---|---|---|
| 2025 | $13,824 | $205,050 | $23,530 | $23,530 |
| 2024 | $13,824 | $174,540 | $18,680 | $155,860 |
| 2023 | $13,524 | $174,540 | $18,680 | $155,860 |
| 2022 | $9,671 | $121,610 | $23,200 | $98,410 |
| 2021 | $9,335 | $125,110 | $23,870 | $101,240 |
| 2020 | $10,343 | $139,400 | $23,870 | $115,530 |
| 2019 | $10,053 | $139,400 | $23,870 | $115,530 |
| 2018 | $9,417 | $121,720 | $19,220 | $102,500 |
| 2017 | $9,389 | $121,720 | $19,220 | $102,500 |
| 2016 | $8,545 | $104,790 | $21,253 | $83,537 |
| 2015 | $8,187 | $115,190 | $21,253 | $93,937 |
| 2014 | $7,625 | $91,810 | $21,317 | $70,493 |
Property History
| Date | Event | Price | List to Sale | Price per Sq Ft |
|---|---|---|---|---|
| 01/21/2026 01/21/26 | Price Changed | $2,650,000 | -5.4% | $548 / Sq Ft |
| 10/29/2025 10/29/25 | For Sale | $2,800,000 | -- | $579 / Sq Ft |
Purchase History
| Date | Type | Sale Price | Title Company |
|---|---|---|---|
| Special Warranty Deed | -- | None Listed On Document | |
| Warranty Deed | $1,300,000 | Stewart Title | |
| Interfamily Deed Transfer | -- | None Available | |
| Interfamily Deed Transfer | -- | None Available | |
| Warranty Deed | $916,500 | -- | |
| Warranty Deed | $665,000 | Land Title |
Mortgage History
| Date | Status | Loan Amount | Loan Type |
|---|---|---|---|
| Previous Owner | $532,000 | No Value Available | |
| Closed | $99,750 | No Value Available |
Source: REcolorado®
MLS Number: 2537229
APN: 5111-23-016
Disclaimer: Certain information contained herein is derived from information provided by parties other than Homes.com. All information provided is deemed reliable, but is not guaranteed to be accurate and should be independently verified.
![]() Based on information submitted to the MLS GRID. All data is obtained from various sources and may not have been verified by broker or MLS GRID. Supplied Open House Information is subject to change without notice. All information should be independently reviewed and verified for accuracy. Properties may or may not be listed by the office/agent presenting the information. Some IDX listings have been excluded from this website. The content relating to real estate for sale in this Web site comes in part from the Internet Data eXchange (“IDX”) program of METROLIST, INC., DBA RECOLORADO®. Real estate listings held by brokers other than Ten-X are marked with the IDX Logo. This information is being provided for the consumers’ personal, non-commercial use and may not be used for any other purpose. All information is subject to change and should be independently verified.
Based on information submitted to the MLS GRID. All data is obtained from various sources and may not have been verified by broker or MLS GRID. Supplied Open House Information is subject to change without notice. All information should be independently reviewed and verified for accuracy. Properties may or may not be listed by the office/agent presenting the information. Some IDX listings have been excluded from this website. The content relating to real estate for sale in this Web site comes in part from the Internet Data eXchange (“IDX”) program of METROLIST, INC., DBA RECOLORADO®. Real estate listings held by brokers other than Ten-X are marked with the IDX Logo. This information is being provided for the consumers’ personal, non-commercial use and may not be used for any other purpose. All information is subject to change and should be independently verified.
This publication is designed to provide information with regard to the subject matter covered. It is displayed with the understanding that the publisher and authors are not engaged in rendering real estate, legal, accounting, tax, or other professional services and that the publisher and authors are not offering such advice in this publication. If real estate, legal, or other expert assistance is required, the services of a competent, professional person should be sought.
The information contained in this publication is subject to change without notice. METROLIST, INC., DBA RECOLORADO MAKES NO WARRANTY OF ANY KIND WITH REGARD TO THIS MATERIAL, INCLUDING, BUT NOT LIMITED TO, THE IMPLIED WARRANTIES OF MERCHANTABILITY AND FITNESS FOR A PARTICULAR PURPOSE. METROLIST, INC., DBA RECOLORADO SHALL NOT BE LIABLE FOR ERRORS CONTAINED HEREIN OR FOR ANY DAMAGES IN CONNECTION WITH THE FURNISHING, PERFORMANCE, OR USE OF THIS MATERIAL.
PUBLISHER’S NOTICE: All real estate advertised herein is subject to the Federal Fair Housing Act and the Colorado Fair Housing Act, which Acts make it illegal to make or publish any advertisement that indicates any preference, limitation, or discrimination based on race, color, religion, sex, handicap, familial status, or national origin.
METROLIST, INC., DBA RECOLORADO will not knowingly accept any advertising for real estate that is in violation of the law. All persons are hereby informed that all dwellings advertised are available on an equal opportunity basis.
© 2026 METROLIST, INC., DBA RECOLORADO® – All Rights Reserved. 6455 S. Yosemite St., Suite 500 Greenwood Village, CO 80111 USA
ALL RIGHTS RESERVED WORLDWIDE. No part of this publication may be reproduced, adapted, translated, stored in a retrieval system or transmitted in any form or by any means, electronic, mechanical, photocopying, recording, or otherwise, without the prior written permission of the publisher. The information contained herein including but not limited to all text, photographs, digital images, virtual tours, may be seeded and monitored for protection and tracking.
Based on information submitted to the MLS GRID
- 2124 E 4th Ave
- 335 Josephine St Unit D
- 477 Josephine St
- 141 Gilpin St
- 580 Race St
- 517 Josephine St
- 395 N Franklin St
- 250 Columbine St Unit 409
- 250 Columbine St Unit 216
- 250 Columbine St Unit 507
- 1617 E 5th Ave
- 375 Clayton St
- 2539 E 5th Ave
- 560 Josephine St
- 525 Columbine St
- 566 Josephine St
- 535 and 545 Columbine St
- 615 N Williams St
- 522 Columbine St
- 434 Clayton St
- 517 Josephine St
- 420 N Downing St
- 2700 E Cherry Creek South Dr Unit 117
- 2700 E Cherry Creek S Dr Unit 117
- 255 Saint Paul St Unit 317
- 255 Saint Paul St Unit 307
- 644 Marion St
- 757 S Clayton St Unit ID1386234P
- 210 Saint Paul St Unit 411
- 100 Steele St
- 99 S Downing St
- 135 Adams St Unit 304
- 135 Adams St Unit 506
- 135 Adams St Unit 503
- 135 Adams St Unit 303
- 135 Adams St Unit 310
- 135 Adams St Unit 211
- 135 Adams St Unit 204
- 135 Adams St
- 3222 E 1st Ave
Ask me questions while you tour the home.