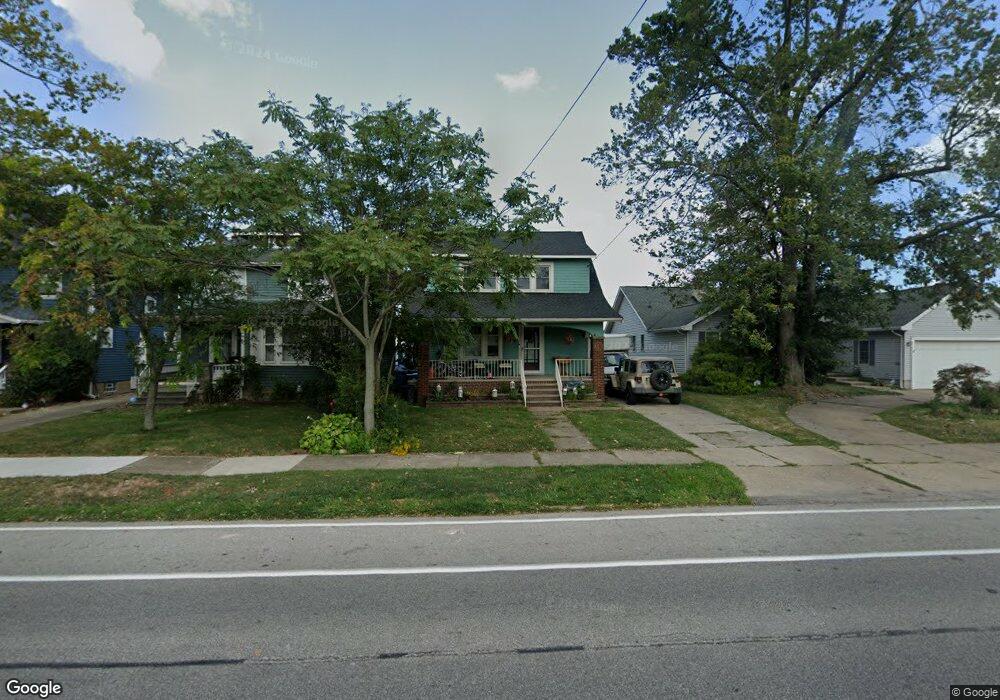
2023 E Erie Ave Lorain, OH 44052
Estimated Value: $275,185 - $298,000
3
Beds
2
Baths
1,931
Sq Ft
$149/Sq Ft
Est. Value
About This Home
This home is located at 2023 E Erie Ave, Lorain, OH 44052 and is currently estimated at $286,796, approximately $148 per square foot. 2023 E Erie Ave is a home located in Lorain County with nearby schools including Larkmoor Elementary School, Longfellow Middle School, and Lorain High School.
Ownership History
Date
Name
Owned For
Owner Type
Purchase Details
Closed on
Jan 4, 2021
Sold by
Galvin Patrick M and Galvin Lori Anne
Bought by
Galvin Patrick M and Galvin Lori Anne
Current Estimated Value
Home Financials for this Owner
Home Financials are based on the most recent Mortgage that was taken out on this home.
Original Mortgage
$152,000
Outstanding Balance
$89,534
Interest Rate
2.9%
Mortgage Type
Future Advance Clause Open End Mortgage
Estimated Equity
$197,262
Purchase Details
Closed on
Nov 4, 2009
Sold by
Siebenhar Joshua G and Siebenhar Melissa A
Bought by
Galvin Patrick M and Repp Lucretia
Home Financials for this Owner
Home Financials are based on the most recent Mortgage that was taken out on this home.
Original Mortgage
$112,433
Interest Rate
5.11%
Mortgage Type
FHA
Purchase Details
Closed on
Oct 16, 2008
Sold by
Estate Of Vaughn T Fink
Bought by
The Vaughn T Fink Trust
Purchase Details
Closed on
Jul 21, 2005
Sold by
Etzkorn Mariel R
Bought by
Siebenhar Joshua C and Fink Vaughn
Create a Home Valuation Report for This Property
The Home Valuation Report is an in-depth analysis detailing your home's value as well as a comparison with similar homes in the area
Home Values in the Area
Average Home Value in this Area
Purchase History
| Date | Buyer | Sale Price | Title Company |
|---|---|---|---|
| Galvin Patrick M | -- | Timios Inc | |
| Galvin Patrick M | -- | Attorney | |
| Galvin Patrick M | $170,000 | Attorney | |
| The Vaughn T Fink Trust | -- | None Available | |
| Siebenhar Joshua C | $238,000 | First American |
Source: Public Records
Mortgage History
| Date | Status | Borrower | Loan Amount |
|---|---|---|---|
| Open | Galvin Patrick M | $152,000 | |
| Closed | Galvin Patrick M | $112,433 |
Source: Public Records
Tax History Compared to Growth
Tax History
| Year | Tax Paid | Tax Assessment Tax Assessment Total Assessment is a certain percentage of the fair market value that is determined by local assessors to be the total taxable value of land and additions on the property. | Land | Improvement |
|---|---|---|---|---|
| 2024 | $3,760 | $91,028 | $32,403 | $58,625 |
| 2023 | $3,114 | $60,242 | $25,396 | $34,846 |
| 2022 | $3,087 | $60,242 | $25,396 | $34,846 |
| 2021 | $3,087 | $60,242 | $25,396 | $34,846 |
| 2020 | $2,974 | $50,410 | $21,250 | $29,160 |
| 2019 | $2,957 | $50,410 | $21,250 | $29,160 |
| 2018 | $2,958 | $50,410 | $21,250 | $29,160 |
| 2017 | $2,418 | $38,900 | $17,970 | $20,930 |
| 2016 | $2,399 | $38,900 | $17,970 | $20,930 |
| 2015 | $2,263 | $38,900 | $17,970 | $20,930 |
| 2014 | $2,025 | $34,890 | $16,120 | $18,770 |
| 2013 | $2,010 | $34,890 | $16,120 | $18,770 |
Source: Public Records
Map
Nearby Homes
- 2235 E Erie Ave
- 1651 E Erie Ave
- 1943 G St
- 2625 E Erie Ave
- 1273 Michigan Ave
- 2417 G St
- 303 Iowa Ave
- 2279 Adams St
- 1318 Maryland Ave
- 1330 Maryland Ave
- 1519 Maine Ave
- 2817 Mckinley St
- 2919 E Erie Ave
- 2927 N Jefferson Blvd
- 2149 Hancock St
- 207 Georgia Ave
- 906 E Erie Ave
- 805 Euclid Ave
- 3031 E Erie Ave
- 0 Eastlawn St Unit 5106705
- 2025 E Erie Ave
- 2019 E Erie Ave
- 2015 E Erie Ave
- 2035 E Erie Ave
- 2105 E Erie Ave
- 2052 E Erie Ave
- 2022 E Erie Ave
- 2034 E Erie Ave
- 2119 E Erie Ave
- 2129 E Erie Ave
- 1954 E Erie Ave
- 2110 E Erie Ave
- 214 Michigan Ave
- 2139 E Erie Ave
- 1934 E Erie Ave
- 2116 E Erie Ave
- 2015 Cleveland Blvd
- 2147 E Erie Ave
- 2039 Cleveland Blvd
- 221 Michigan Ave