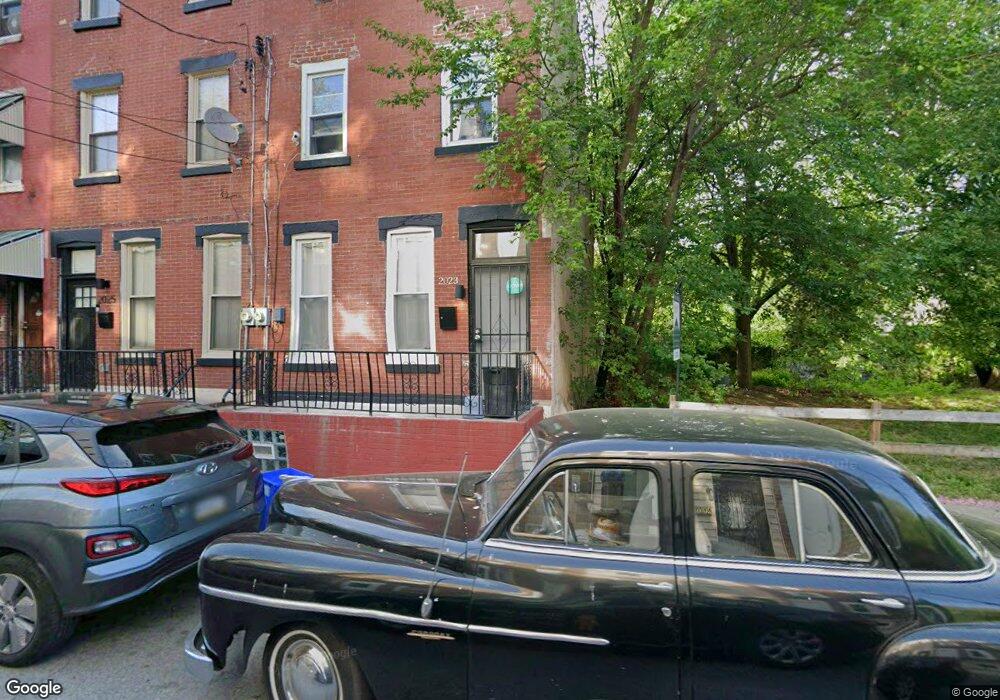
2023 N Woodstock St Philadelphia, PA 19121
North Philadelphia West NeighborhoodEstimated Value: $210,655 - $312,000
5
Beds
2
Baths
1,515
Sq Ft
$163/Sq Ft
Est. Value
About This Home
This home is located at 2023 N Woodstock St, Philadelphia, PA 19121 and is currently estimated at $247,664, approximately $163 per square foot. 2023 N Woodstock St is a home located in Philadelphia County with nearby schools including Strawberry Mansion High School, Frederick Douglass Elementary, and Wissahickon Charter School.
Ownership History
Date
Name
Owned For
Owner Type
Purchase Details
Closed on
Aug 9, 2010
Sold by
Kent Hildegard and Indymac Bank Fsb
Bought by
Mohammed Sureya K
Current Estimated Value
Purchase Details
Closed on
Mar 30, 2007
Sold by
Macean Guerline
Bought by
Kent Hildegard
Home Financials for this Owner
Home Financials are based on the most recent Mortgage that was taken out on this home.
Original Mortgage
$178,500
Interest Rate
9.37%
Mortgage Type
Purchase Money Mortgage
Purchase Details
Closed on
Dec 30, 2005
Sold by
Green Earlene
Bought by
Macean Guerline
Home Financials for this Owner
Home Financials are based on the most recent Mortgage that was taken out on this home.
Original Mortgage
$126,270
Interest Rate
6.75%
Mortgage Type
Fannie Mae Freddie Mac
Purchase Details
Closed on
Apr 14, 2005
Sold by
Waller Angela M
Bought by
Green Earlene
Purchase Details
Closed on
Aug 13, 1996
Sold by
Clark Earlene G
Bought by
Waller Angela M
Create a Home Valuation Report for This Property
The Home Valuation Report is an in-depth analysis detailing your home's value as well as a comparison with similar homes in the area
Home Values in the Area
Average Home Value in this Area
Purchase History
| Date | Buyer | Sale Price | Title Company |
|---|---|---|---|
| Mohammed Sureya K | $64,000 | None Available | |
| Kent Hildegard | $210,000 | None Available | |
| Macean Guerline | $157,837 | None Available | |
| Green Earlene | -- | -- | |
| Waller Angela M | -- | -- |
Source: Public Records
Mortgage History
| Date | Status | Borrower | Loan Amount |
|---|---|---|---|
| Previous Owner | Kent Hildegard | $178,500 | |
| Previous Owner | Macean Guerline | $126,270 |
Source: Public Records
Tax History Compared to Growth
Tax History
| Year | Tax Paid | Tax Assessment Tax Assessment Total Assessment is a certain percentage of the fair market value that is determined by local assessors to be the total taxable value of land and additions on the property. | Land | Improvement |
|---|---|---|---|---|
| 2026 | $2,049 | $178,600 | $35,700 | $142,900 |
| 2025 | $2,049 | $178,600 | $35,700 | $142,900 |
| 2024 | $2,049 | $178,600 | $35,700 | $142,900 |
| 2023 | $2,049 | $146,400 | $29,200 | $117,200 |
| 2022 | $1,839 | $146,400 | $29,200 | $117,200 |
| 2021 | $1,839 | $0 | $0 | $0 |
| 2020 | $1,839 | $0 | $0 | $0 |
| 2019 | $1,779 | $0 | $0 | $0 |
| 2018 | $1,190 | $0 | $0 | $0 |
| 2017 | $2,696 | $0 | $0 | $0 |
| 2016 | $2,696 | $0 | $0 | $0 |
| 2015 | $1,206 | $0 | $0 | $0 |
| 2014 | -- | $90,000 | $5,124 | $84,876 |
| 2012 | -- | $6,400 | $960 | $5,440 |
Source: Public Records
Map
Nearby Homes
- 2022 N 20th St
- 2014 N 20th St
- 2010 N 20th St
- 2025 N Woodstock St
- 2022 N Woodstock St
- 1938 Page St
- 2046 N 20th St
- 1939 Fontain St
- 1937 Fontain St
- 1920 Fontain St
- 2034 N Lambert St
- 1907 W Norris St
- 1926 W Diamond St
- 1912 Page St
- 1910 Page St
- 1920 W Norris St
- 2036 N 19th St
- 2102 N 20th St
- 2104 N 20th St
- 1902 W Diamond St
- 2021 N Woodstock St
- 2027 N Woodstock St
- 2019 N Woodstock St
- 2029 N Woodstock St
- 2017 N Woodstock St
- 2017-2021 N Woodstock St
- 2031 N Woodstock St
- 2015 N Woodstock St
- 2013 N Woodstock St
- 2033 N Woodstock St
- 2018 N Woodstock St
- 2024 N 20th St
- 2026 N 20th St
- 2028 N 20th St
- 2014 N Woodstock St
- 2020 N 20th St
- 2020 N Woodstock St
- 2011 N Woodstock St
- 2035 N Woodstock St
- 2018 N 20th St