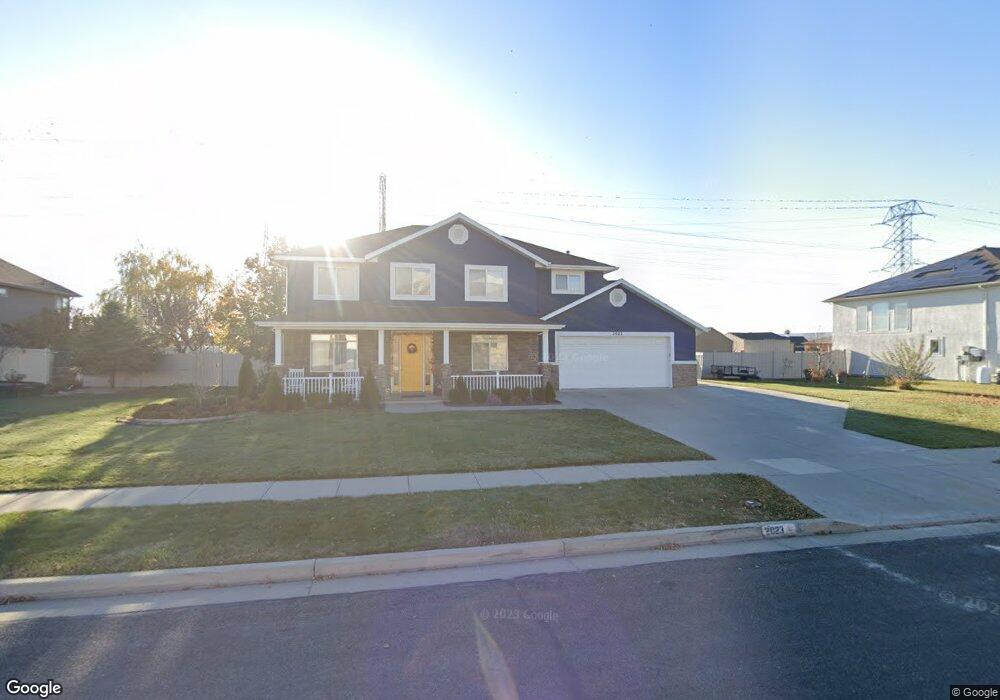
2023 Ranch Rd Farmington, UT 84025
Estimated Value: $782,000 - $829,000
4
Beds
3
Baths
2,961
Sq Ft
$269/Sq Ft
Est. Value
About This Home
This home is located at 2023 Ranch Rd, Farmington, UT 84025 and is currently estimated at $797,590, approximately $269 per square foot. 2023 Ranch Rd is a home located in Davis County with nearby schools including Eagle Bay Elementary School, Farmington High, and Farmington Junior High School.
Ownership History
Date
Name
Owned For
Owner Type
Purchase Details
Closed on
Oct 18, 2017
Sold by
Marietta Jennifer and Marietta Todd
Bought by
Inauen Christian and Inauen Michelle
Current Estimated Value
Home Financials for this Owner
Home Financials are based on the most recent Mortgage that was taken out on this home.
Original Mortgage
$324,000
Outstanding Balance
$176,123
Interest Rate
3.83%
Mortgage Type
New Conventional
Estimated Equity
$621,467
Purchase Details
Closed on
Apr 25, 2005
Sold by
Marieta Jennifer
Bought by
Marietta Jennefer and Marietta Todd
Home Financials for this Owner
Home Financials are based on the most recent Mortgage that was taken out on this home.
Original Mortgage
$256,500
Interest Rate
6%
Mortgage Type
Adjustable Rate Mortgage/ARM
Purchase Details
Closed on
Mar 31, 2004
Sold by
Boyer Wheeler Farm Lc
Bought by
Marietta Jennifer R
Create a Home Valuation Report for This Property
The Home Valuation Report is an in-depth analysis detailing your home's value as well as a comparison with similar homes in the area
Home Values in the Area
Average Home Value in this Area
Purchase History
| Date | Buyer | Sale Price | Title Company |
|---|---|---|---|
| Inauen Christian | -- | Us Title | |
| Marietta Jennefer | -- | None Available | |
| Marietta Jennifer R | -- | Bonneville Title Company Inc |
Source: Public Records
Mortgage History
| Date | Status | Borrower | Loan Amount |
|---|---|---|---|
| Open | Inauen Christian | $324,000 | |
| Previous Owner | Marietta Jennefer | $256,500 |
Source: Public Records
Tax History Compared to Growth
Tax History
| Year | Tax Paid | Tax Assessment Tax Assessment Total Assessment is a certain percentage of the fair market value that is determined by local assessors to be the total taxable value of land and additions on the property. | Land | Improvement |
|---|---|---|---|---|
| 2025 | $3,963 | $355,300 | $202,065 | $153,235 |
| 2024 | $3,935 | $363,550 | $170,206 | $193,344 |
| 2023 | $3,799 | $649,000 | $258,760 | $390,240 |
| 2022 | $3,724 | $359,700 | $139,039 | $220,661 |
| 2021 | $3,418 | $490,000 | $171,150 | $318,850 |
| 2020 | $3,134 | $437,000 | $159,727 | $277,273 |
| 2019 | $3,103 | $423,000 | $157,429 | $265,571 |
| 2018 | $2,918 | $392,000 | $145,303 | $246,697 |
| 2016 | $2,621 | $187,000 | $62,114 | $124,886 |
| 2015 | $2,558 | $175,340 | $62,114 | $113,226 |
| 2014 | $2,355 | $167,665 | $45,715 | $121,950 |
| 2013 | -- | $182,132 | $50,604 | $131,528 |
Source: Public Records
Map
Nearby Homes
- Harvard Plan at Eastridge Estates
- Fortissimo Plan at Eastridge Estates
- Crescendo Plan at Eastridge Estates
- Browning Plan at Eastridge Estates
- Adagio Plan at Eastridge Estates
- Harrison Plan at Eastridge Estates
- Timpani Plan at Eastridge Estates
- Ballad Plan at Eastridge Estates
- Anthem Plan at Eastridge Estates
- Bravo Plan at Eastridge Estates
- Canon Plan at Eastridge Estates
- Treble Plan at Eastridge Estates
- Madrigal Plan at Eastridge Estates
- Trio Plan at Eastridge Estates
- Tempo Plan at Eastridge Estates
- Tenor Plan at Eastridge Estates
- Interlude Plan at Eastridge Estates
- Octave Plan at Eastridge Estates
- Accord Plan at Eastridge Estates
- Finale Plan at Eastridge Estates
- 2023 W Ranch Rd
- 2039 W Ranch Rd
- 2039 Ranch Rd
- 2017 W Ranch Rd Unit 207
- 2017 W Ranch Rd
- 2007 Ranch Rd
- 2007 W Ranch Rd
- 2026 Ranch Rd
- 2018 Ranch Rd
- 2026 W Ranch Rd
- 2018 W Ranch Rd
- 2032 Ranch Rd
- 2032 W Ranch Rd
- 91 Ranch Rd
- 1996 Ranch Rd
- 1996 W Ranch Rd
- 1993 Ranch Rd
- 2048 W Ranch Rd N
- 97 N Clark Ln
- 97 Ranch Rd