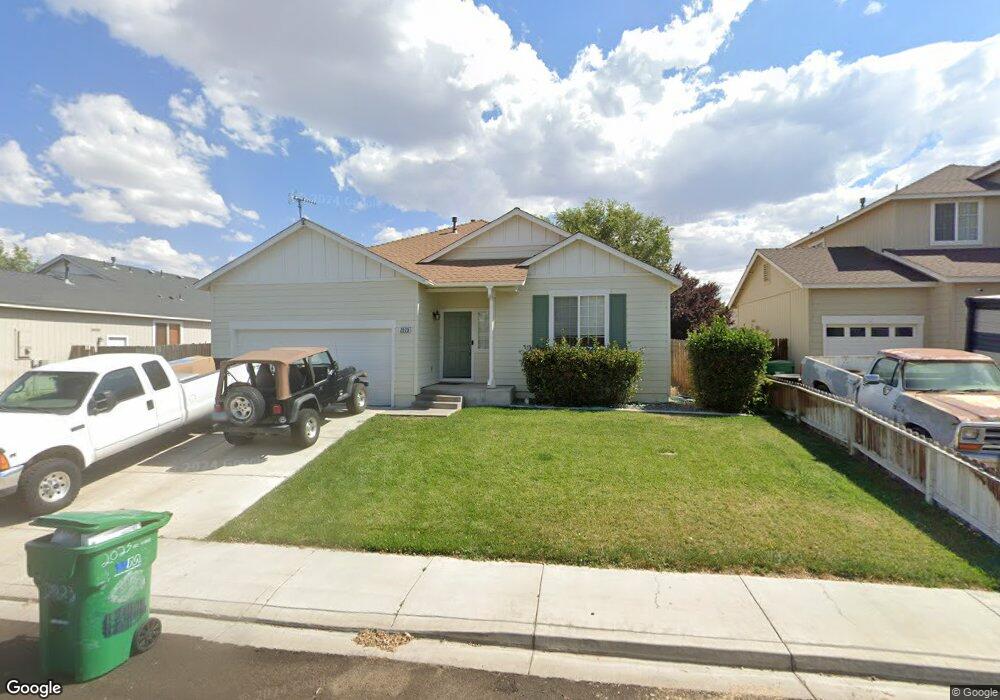
2023 Rawles Dr Unit 7 Fernley, NV 89408
Estimated Value: $397,000 - $422,000
3
Beds
2
Baths
2,008
Sq Ft
$204/Sq Ft
Est. Value
About This Home
This home is located at 2023 Rawles Dr Unit 7, Fernley, NV 89408 and is currently estimated at $410,231, approximately $204 per square foot. 2023 Rawles Dr Unit 7 is a home located in Lyon County with nearby schools including Cottonwood Elementary School, Fernley Intermediate School, and Fernley High School.
Ownership History
Date
Name
Owned For
Owner Type
Purchase Details
Closed on
Jul 21, 2011
Sold by
Venzon Alfred A
Bought by
King Matthew H
Current Estimated Value
Home Financials for this Owner
Home Financials are based on the most recent Mortgage that was taken out on this home.
Original Mortgage
$111,917
Outstanding Balance
$76,777
Interest Rate
4.45%
Mortgage Type
New Conventional
Estimated Equity
$333,454
Purchase Details
Closed on
Jan 26, 2005
Sold by
Venzon Lorilei C
Bought by
Venzon Alfred A
Home Financials for this Owner
Home Financials are based on the most recent Mortgage that was taken out on this home.
Original Mortgage
$181,500
Interest Rate
6.37%
Mortgage Type
Adjustable Rate Mortgage/ARM
Create a Home Valuation Report for This Property
The Home Valuation Report is an in-depth analysis detailing your home's value as well as a comparison with similar homes in the area
Home Values in the Area
Average Home Value in this Area
Purchase History
| Date | Buyer | Sale Price | Title Company |
|---|---|---|---|
| King Matthew H | $108,000 | First Centennial Title Co Nv | |
| Venzon Alfred A | $201,681 | Western Title Company Inc | |
| Venzon Alfred A | $201,681 | Western Title Company Inc |
Source: Public Records
Mortgage History
| Date | Status | Borrower | Loan Amount |
|---|---|---|---|
| Open | King Matthew H | $111,917 | |
| Previous Owner | Venzon Alfred A | $181,500 |
Source: Public Records
Tax History Compared to Growth
Tax History
| Year | Tax Paid | Tax Assessment Tax Assessment Total Assessment is a certain percentage of the fair market value that is determined by local assessors to be the total taxable value of land and additions on the property. | Land | Improvement |
|---|---|---|---|---|
| 2025 | $1,908 | $119,988 | $43,750 | $76,238 |
| 2024 | $2,262 | $120,403 | $43,750 | $76,652 |
| 2023 | $2,262 | $115,613 | $43,750 | $71,863 |
| 2022 | $2,126 | $110,358 | $43,750 | $66,608 |
| 2021 | $2,101 | $95,935 | $30,800 | $65,135 |
| 2020 | $2,047 | $92,803 | $30,800 | $62,003 |
| 2019 | $2,016 | $87,661 | $28,000 | $59,661 |
| 2018 | $1,972 | $79,231 | $21,000 | $58,231 |
| 2017 | $1,960 | $71,341 | $13,130 | $58,211 |
| 2016 | $1,765 | $59,047 | $5,780 | $53,267 |
| 2015 | $1,800 | $39,736 | $5,780 | $33,956 |
| 2014 | $1,756 | $37,231 | $5,780 | $31,451 |
Source: Public Records
Map
Nearby Homes
- 1315 Winnies Ln
- 1625 Picetti Way
- 1740 Johns Cir
- 1616 Laverder Dr
- 1563 Maria Ct
- 1353 Winnies Ln
- 1409 Jennys Ln
- 1671 Vista Moon Ct
- 1165 Jenny's Ln
- 1285 Camille Dr
- 1300 Rancho Rd
- 1405 Buckboard Way
- 1240-1250 Farm District Rd
- 675 Warren Way
- 1075 Browne Ln
- 021 46103
- 870 Jennys Ln
- 27 Simons Rd
- APN 021-191-08
- 863 Jennys Ln
- 2027 Rawles Dr
- 2019 Rawles Dr
- 1688 Harvest Creek Way
- 1690 Harvest Creek Way
- 2031 Rawles Dr
- 2024 Rawles Dr
- 2020 Rawles Dr
- 2028 Rawles Dr
- 2011 Rawles Dr
- 1694 Harvest Creek Way
- 1681 Pine Ridge Dr
- 2035 Rawles Dr
- 2032 Rawles Dr
- 2016 Rawles Dr
- 2007 Rawles Dr
- 1729 Autumn Glen St
- 1696 Harvest Creek Way
- 1683 Pine Ridge Dr
- 2012 Rawles Dr