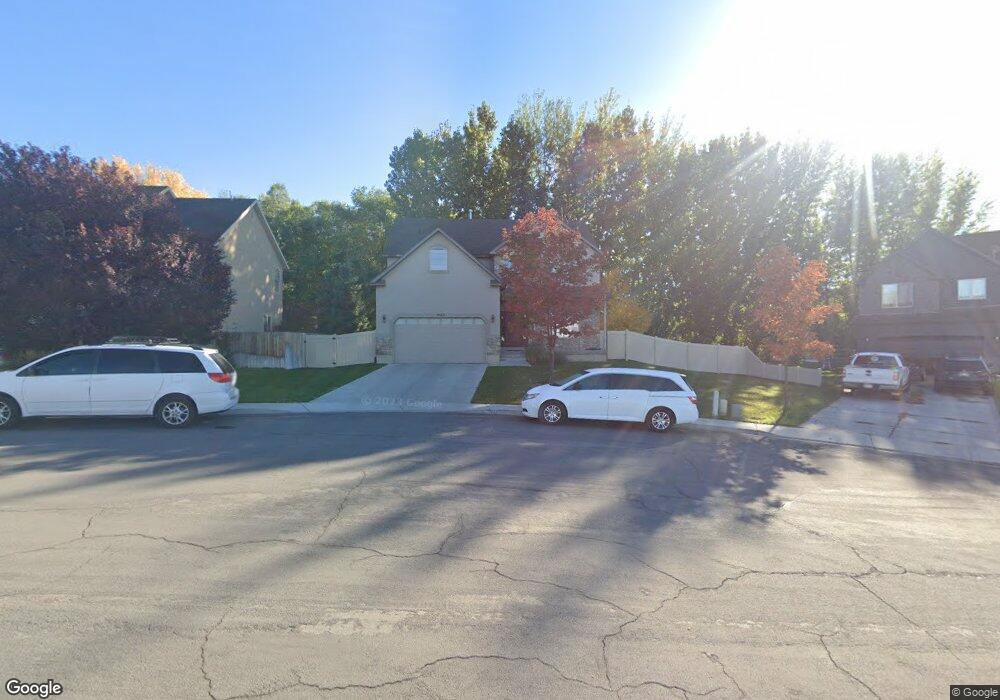
2023 S 330 W Orem, UT 84058
Lakeview NeighborhoodEstimated Value: $644,000 - $713,000
4
Beds
3
Baths
3,668
Sq Ft
$184/Sq Ft
Est. Value
About This Home
This home is located at 2023 S 330 W, Orem, UT 84058 and is currently estimated at $673,177, approximately $183 per square foot. 2023 S 330 W is a home located in Utah County with nearby schools including Cherry Hill Elementary School, Lakeridge Jr High School, and Mountain View High School.
Ownership History
Date
Name
Owned For
Owner Type
Purchase Details
Closed on
Feb 19, 2010
Sold by
Richmond Regan Tyler
Bought by
Serna Huver and Serna Jaqueline
Current Estimated Value
Home Financials for this Owner
Home Financials are based on the most recent Mortgage that was taken out on this home.
Original Mortgage
$222,888
Outstanding Balance
$150,941
Interest Rate
5.5%
Mortgage Type
FHA
Estimated Equity
$522,236
Purchase Details
Closed on
Jun 28, 2007
Sold by
J Ballard Homes Inc
Bought by
Richmond Regan Tyler
Home Financials for this Owner
Home Financials are based on the most recent Mortgage that was taken out on this home.
Original Mortgage
$42,950
Interest Rate
6.41%
Mortgage Type
Credit Line Revolving
Create a Home Valuation Report for This Property
The Home Valuation Report is an in-depth analysis detailing your home's value as well as a comparison with similar homes in the area
Home Values in the Area
Average Home Value in this Area
Purchase History
| Date | Buyer | Sale Price | Title Company |
|---|---|---|---|
| Serna Huver | -- | Canyon View Title Insurance | |
| Richmond Regan Tyler | -- | Excel Title Insurance Agenc |
Source: Public Records
Mortgage History
| Date | Status | Borrower | Loan Amount |
|---|---|---|---|
| Open | Serna Huver | $222,888 | |
| Previous Owner | Richmond Regan Tyler | $42,950 | |
| Previous Owner | Richmond Regan Tyler | $343,800 |
Source: Public Records
Tax History
| Year | Tax Paid | Tax Assessment Tax Assessment Total Assessment is a certain percentage of the fair market value that is determined by local assessors to be the total taxable value of land and additions on the property. | Land | Improvement |
|---|---|---|---|---|
| 2025 | $2,641 | $334,070 | -- | -- |
| 2024 | $2,641 | $322,905 | $0 | $0 |
| 2023 | $2,477 | $325,600 | $0 | $0 |
| 2022 | $2,380 | $303,050 | $0 | $0 |
| 2021 | $2,218 | $427,700 | $178,600 | $249,100 |
| 2020 | $2,042 | $387,100 | $142,900 | $244,200 |
| 2019 | $1,929 | $380,200 | $142,900 | $237,300 |
| 2018 | $1,897 | $357,300 | $125,500 | $231,800 |
| 2017 | $1,891 | $190,740 | $0 | $0 |
| 2016 | $1,822 | $169,510 | $0 | $0 |
| 2015 | $1,905 | $167,585 | $0 | $0 |
| 2014 | $1,841 | $161,260 | $0 | $0 |
Source: Public Records
Map
Nearby Homes
Your Personal Tour Guide
Ask me questions while you tour the home.