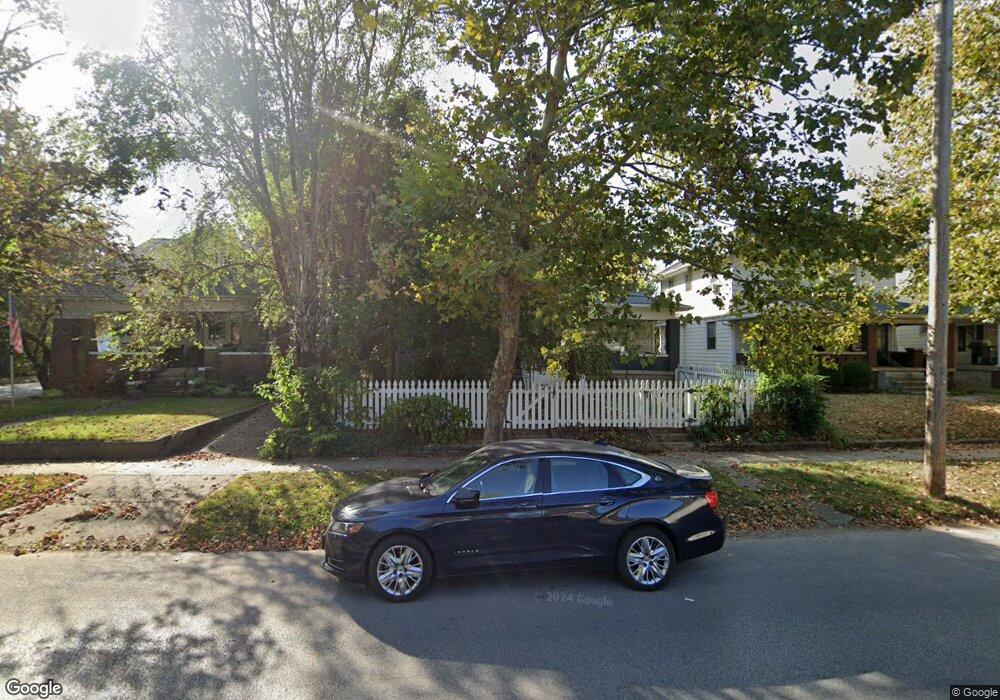
2023 S 7th St Unit 2025 S. 7th Street Terre Haute, IN 47802
Southland-Sarah Scott NeighborhoodEstimated Value: $190,000 - $214,000
7
Beds
3
Baths
3,522
Sq Ft
$57/Sq Ft
Est. Value
About This Home
This home is located at 2023 S 7th St Unit 2025 S. 7th Street, Terre Haute, IN 47802 and is currently estimated at $201,049, approximately $57 per square foot. 2023 S 7th St Unit 2025 S. 7th Street is a home located in Vigo County with nearby schools including Farrington Grove Elementary School, Sarah Scott Middle School, and Terre Haute South Vigo High School.
Ownership History
Date
Name
Owned For
Owner Type
Purchase Details
Closed on
Nov 26, 2024
Sold by
Fields Mikayla J
Bought by
The Wright Group Investments Llc
Current Estimated Value
Purchase Details
Closed on
Mar 10, 2021
Sold by
Biddle Christian T
Bought by
Biddle Devleopment Llc
Purchase Details
Closed on
Dec 27, 2019
Sold by
Biddle Real Estate Properties Llc
Bought by
Biddle Development Llc
Purchase Details
Closed on
Aug 28, 2019
Sold by
Biddle Troy L and Biddle Pam
Bought by
Biddle Real Estate Properties Llc
Purchase Details
Closed on
Nov 23, 2009
Sold by
Wilson Timothy D and Wilson Deborah J
Bought by
Adams Marvin D
Home Financials for this Owner
Home Financials are based on the most recent Mortgage that was taken out on this home.
Original Mortgage
$9,100
Interest Rate
4.95%
Mortgage Type
New Conventional
Create a Home Valuation Report for This Property
The Home Valuation Report is an in-depth analysis detailing your home's value as well as a comparison with similar homes in the area
Home Values in the Area
Average Home Value in this Area
Purchase History
| Date | Buyer | Sale Price | Title Company |
|---|---|---|---|
| The Wright Group Investments Llc | $209,900 | Hendrich Title Company | |
| Biddle Devleopment Llc | $139,900 | None Available | |
| Biddle Development Llc | -- | None Available | |
| Biddle Real Estate Properties Llc | -- | None Available | |
| Adams Marvin D | -- | -- |
Source: Public Records
Mortgage History
| Date | Status | Borrower | Loan Amount |
|---|---|---|---|
| Previous Owner | Adams Marvin D | $9,100 |
Source: Public Records
Tax History Compared to Growth
Tax History
| Year | Tax Paid | Tax Assessment Tax Assessment Total Assessment is a certain percentage of the fair market value that is determined by local assessors to be the total taxable value of land and additions on the property. | Land | Improvement |
|---|---|---|---|---|
| 2024 | $3,637 | $168,200 | $10,000 | $158,200 |
| 2023 | $3,468 | $160,400 | $10,000 | $150,400 |
| 2022 | $3,171 | $146,900 | $10,000 | $136,900 |
| 2021 | $2,108 | $135,000 | $9,800 | $125,200 |
| 2020 | $2,005 | $128,800 | $9,600 | $119,200 |
| 2019 | $1,891 | $126,400 | $9,400 | $117,000 |
| 2018 | $2,560 | $121,700 | $9,100 | $112,600 |
| 2017 | $1,674 | $119,700 | $9,000 | $110,700 |
| 2016 | $1,700 | $119,700 | $9,000 | $110,700 |
| 2014 | $1,170 | $117,000 | $8,900 | $108,100 |
| 2013 | $1,170 | $88,200 | $8,700 | $79,500 |
Source: Public Records
Map
Nearby Homes
- 2021 S 7th St
- 2031 S 7th St
- 2015 S 7th St
- 2011 S 7th St
- 2101 S 7th St
- 2005 S 7th St
- 2026 S Center St
- 2030 S Center St
- 2105 S 7th St
- 2022 S Center St
- 2001 S 7th St
- 2010 S Center St
- 2018 S 7th St
- 2030 S 7th St
- 2014 S Center St Unit Lot 53
- 2109 S 7th St
- 2100 S Center St
- 2006 S Center St
- 2006 S 7th St
- 2100 S 7th St Unit 2