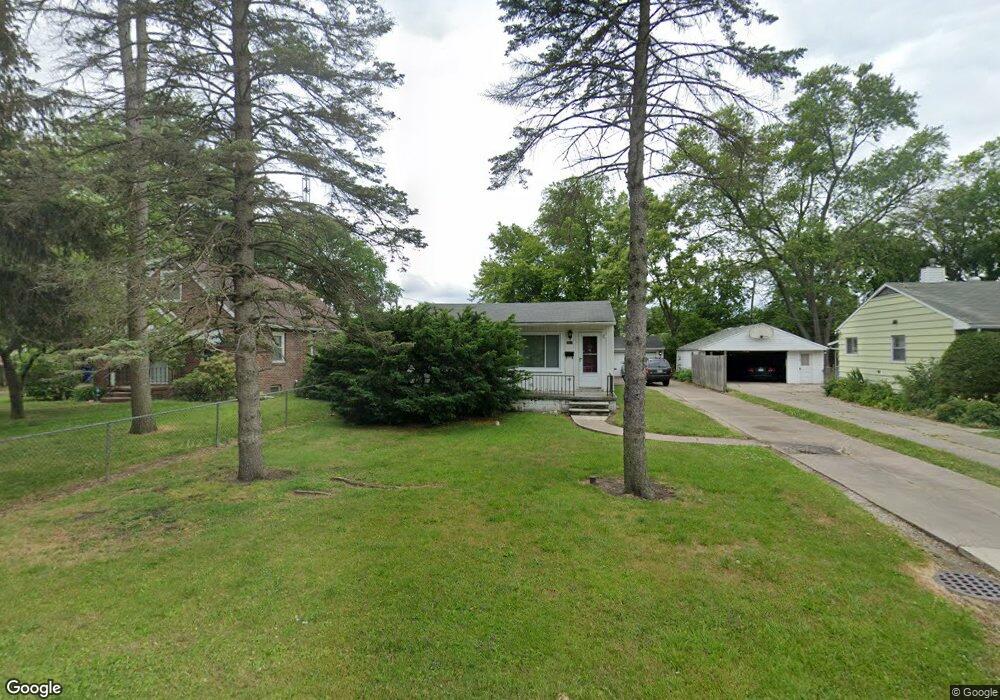
2023 Stoneham Rd Toledo, OH 43615
Reynolds Corners NeighborhoodEstimated Value: $91,140 - $121,000
2
Beds
1
Bath
766
Sq Ft
$132/Sq Ft
Est. Value
About This Home
This home is located at 2023 Stoneham Rd, Toledo, OH 43615 and is currently estimated at $101,035, approximately $131 per square foot. 2023 Stoneham Rd is a home located in Lucas County with nearby schools including Hawkins Elementary School, Rogers High School, and St. Benedict Catholic School.
Ownership History
Date
Name
Owned For
Owner Type
Purchase Details
Closed on
Oct 14, 2024
Sold by
Gutierrez Kevin J
Bought by
Diehl Helen F
Current Estimated Value
Purchase Details
Closed on
Nov 16, 2001
Sold by
Bahrs Douglas and Bahrs Carolyne I
Bought by
Gutierrez Kevin J and Gutierrez Helen D
Home Financials for this Owner
Home Financials are based on the most recent Mortgage that was taken out on this home.
Original Mortgage
$39,750
Interest Rate
6.69%
Purchase Details
Closed on
Nov 13, 2001
Sold by
Ogle Nancy L
Bought by
Bahrs Douglas
Home Financials for this Owner
Home Financials are based on the most recent Mortgage that was taken out on this home.
Original Mortgage
$39,750
Interest Rate
6.69%
Purchase Details
Closed on
Nov 8, 1989
Sold by
Peebles William F
Create a Home Valuation Report for This Property
The Home Valuation Report is an in-depth analysis detailing your home's value as well as a comparison with similar homes in the area
Home Values in the Area
Average Home Value in this Area
Purchase History
| Date | Buyer | Sale Price | Title Company |
|---|---|---|---|
| Diehl Helen F | -- | None Listed On Document | |
| Gutierrez Kevin J | $53,000 | Louisville Title Agency For | |
| Bahrs Douglas | $28,000 | Louisville Title Agency For | |
| -- | -- | -- |
Source: Public Records
Mortgage History
| Date | Status | Borrower | Loan Amount |
|---|---|---|---|
| Previous Owner | Gutierrez Kevin J | $39,750 |
Source: Public Records
Tax History Compared to Growth
Tax History
| Year | Tax Paid | Tax Assessment Tax Assessment Total Assessment is a certain percentage of the fair market value that is determined by local assessors to be the total taxable value of land and additions on the property. | Land | Improvement |
|---|---|---|---|---|
| 2024 | $686 | $20,405 | $5,635 | $14,770 |
| 2023 | $1,219 | $17,080 | $4,585 | $12,495 |
| 2022 | $1,205 | $17,080 | $4,585 | $12,495 |
| 2021 | $1,248 | $17,080 | $4,585 | $12,495 |
| 2020 | $1,199 | $14,140 | $3,815 | $10,325 |
| 2019 | $1,155 | $14,140 | $3,815 | $10,325 |
| 2018 | $1,098 | $14,140 | $3,815 | $10,325 |
| 2017 | $1,001 | $11,585 | $4,270 | $7,315 |
| 2016 | $1,017 | $33,100 | $12,200 | $20,900 |
| 2015 | $1,034 | $33,100 | $12,200 | $20,900 |
| 2014 | $749 | $11,590 | $4,270 | $7,320 |
| 2013 | $749 | $11,590 | $4,270 | $7,320 |
Source: Public Records
Map
Nearby Homes
- 1966 Devinci Dr
- 1911 N Holland Sylvania Rd
- 2015 Oakside Rd
- 2010 Oakside Rd
- 2004 Oakside Rd
- 1930 Birkdale Rd
- 1916 Birkdale Rd
- 2113 Broadstone Rd
- 5665 Camberley Dr
- 405 N Holland Sylvania Rd
- 5743 Candlestick Ct E
- 1709 Acorn Dr
- 1925 Olimphia Rd
- 1715 Brooklynn Park W
- 2523 Briarwood Ln
- 5331 Fleet Rd
- 2537 Vaness Dr
- 2515 Orchard Hills Blvd
- 4860 Airport Hwy
- 1101 Sawyer Rd
- 2029 Stoneham Rd
- 2015 Stoneham Rd
- 2039 Stoneham Rd
- 2005 Stoneham Rd
- 5841 Parkstone Dr
- 2020 Stoneham Rd
- 2030 Stoneham Rd
- 2004 Stoneham Rd
- 2044 Stoneham Rd
- 1986 Devinci Dr
- 1986 Devinci Dr Unit B206
- 0 Devinci Dr Unit 5028202
- 0 Devinci Dr Unit 5028216
- 2103 Stoneham Rd
- 1984 Devinci Dr Unit B106
- 1980 Devinci Dr
- 2023 Sandown Rd
- 2033 Sandown Rd
- 1956 Devinci Dr Unit A101
- 1982 Devinci Dr