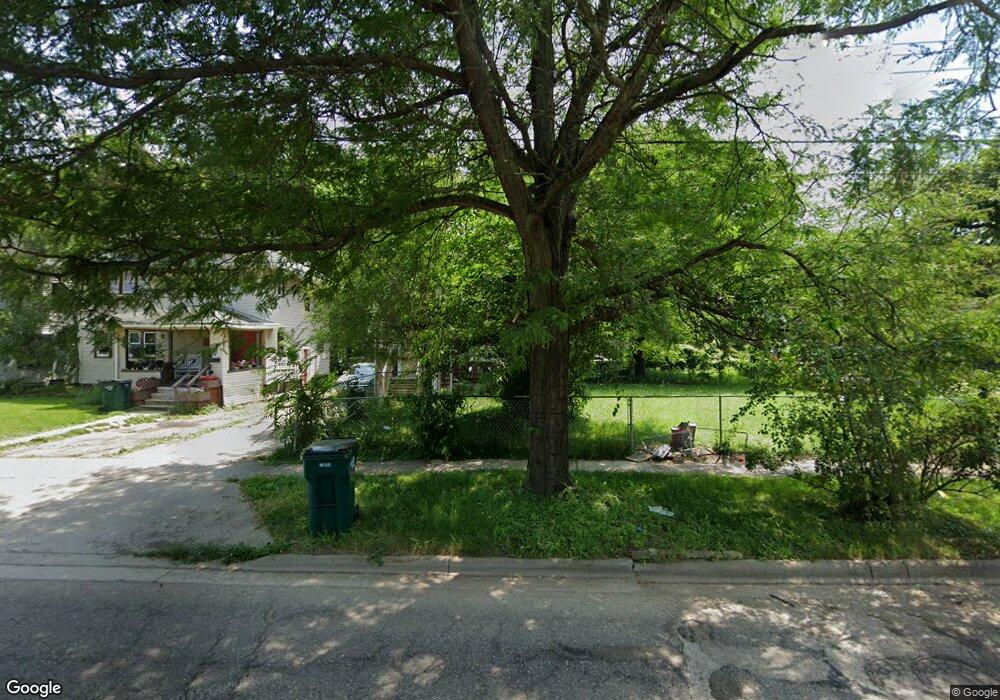
2023 W Malcolm x St Lansing, MI 48915
Westside NeighborhoodEstimated Value: $113,000 - $146,000
--
Bed
1
Bath
1,480
Sq Ft
$89/Sq Ft
Est. Value
About This Home
This home is located at 2023 W Malcolm x St, Lansing, MI 48915 and is currently estimated at $132,208, approximately $89 per square foot. 2023 W Malcolm x St is a home located in Ingham County with nearby schools including Riddle Elementary School, Pattengill Academy, and J.W. Sexton High School.
Ownership History
Date
Name
Owned For
Owner Type
Purchase Details
Closed on
Nov 12, 2024
Sold by
Ingham County Treasurer
Bought by
Rent 2 U Llc
Current Estimated Value
Purchase Details
Closed on
Dec 7, 2011
Sold by
Donovan Shaun
Bought by
Eaton Christina M
Purchase Details
Closed on
Oct 19, 2011
Sold by
Pnc Bank National Association
Bought by
The Secretary Of Housing & Urban Develop
Purchase Details
Closed on
Jan 6, 2011
Sold by
Eby Jill
Bought by
Pnc Bank National Association
Purchase Details
Closed on
Oct 24, 2002
Sold by
Souri George M
Bought by
Eby Jill M
Home Financials for this Owner
Home Financials are based on the most recent Mortgage that was taken out on this home.
Original Mortgage
$76,105
Interest Rate
6.08%
Mortgage Type
FHA
Purchase Details
Closed on
Apr 1, 2002
Sold by
Hud
Bought by
Souri George M
Purchase Details
Closed on
Nov 30, 2000
Sold by
Taylor Leola
Bought by
Aurora Loan Services Inc
Purchase Details
Closed on
Oct 19, 1999
Sold by
Aurora Loan Services Inc
Bought by
Hud
Create a Home Valuation Report for This Property
The Home Valuation Report is an in-depth analysis detailing your home's value as well as a comparison with similar homes in the area
Home Values in the Area
Average Home Value in this Area
Purchase History
| Date | Buyer | Sale Price | Title Company |
|---|---|---|---|
| Rent 2 U Llc | $19,500 | None Listed On Document | |
| Rent 2 U Llc | $19,500 | None Listed On Document | |
| Eaton Christina M | $13,100 | None Available | |
| The Secretary Of Housing & Urban Develop | -- | None Available | |
| Pnc Bank National Association | $70,884 | None Available | |
| Eby Jill M | $77,300 | Transnation Title | |
| Souri George M | $21,800 | -- | |
| Aurora Loan Services Inc | $37,889 | -- | |
| Hud | -- | -- |
Source: Public Records
Mortgage History
| Date | Status | Borrower | Loan Amount |
|---|---|---|---|
| Previous Owner | Eby Jill M | $76,105 |
Source: Public Records
Tax History Compared to Growth
Tax History
| Year | Tax Paid | Tax Assessment Tax Assessment Total Assessment is a certain percentage of the fair market value that is determined by local assessors to be the total taxable value of land and additions on the property. | Land | Improvement |
|---|---|---|---|---|
| 2025 | $5,747 | $55,900 | $4,800 | $51,100 |
| 2024 | $46 | $60,100 | $4,800 | $55,300 |
| 2023 | $10,557 | $51,900 | $4,800 | $47,100 |
| 2022 | $4,619 | $46,600 | $5,200 | $41,400 |
| 2021 | $3,717 | $42,700 | $5,200 | $37,500 |
| 2020 | $2,157 | $40,900 | $5,200 | $35,700 |
| 2019 | $3,951 | $37,000 | $5,200 | $31,800 |
| 2018 | $2,268 | $35,600 | $5,200 | $30,400 |
| 2017 | $2,335 | $35,600 | $5,200 | $30,400 |
| 2016 | $4,515 | $34,900 | $5,200 | $29,700 |
| 2015 | $4,515 | $33,900 | $10,323 | $23,577 |
| 2014 | $4,515 | $31,200 | $7,500 | $23,700 |
Source: Public Records
Map
Nearby Homes
- 2000 William St
- 1901 W Malcolm x St
- 1615 William St
- 1912 Moores River Dr
- 602 S Jenison Ave
- 817 Middle St
- 1516 Moores River Dr
- 1309 W Lenawee St
- 2614 W Kalamazoo St
- 1140 W Lenawee St
- 1128 W Lenawee St
- 1221 Moores River Dr
- 201 S Jenison Ave
- 1511 Pattengill Ave
- 115 Haze St
- 1804 W Michigan Ave
- 122 Hathaway St
- 2805 W Washtenaw St
- V/L Moores River Dr
- 1128 W Washtenaw St
- 2023 W Malcolm x St
- 2019 W Malcolm x St
- 2019 W Malcolm x St
- 813 Buffalo St
- 2015 W Malcolm x St
- 815 Buffalo St
- 2003 W Malcolm x St
- 2003 Malcolm
- 2109 W Malcolm x St
- 812 Buffalo St
- 2014 William St
- 816 Buffalo St
- 2028 William St
- 2010 William St
- 2111 W Malcolm x St Unit 1
- 818 Buffalo St
- 2006 William St
- 2004 William St
- 2117 W Malcolm x St
- 824 Buffalo St