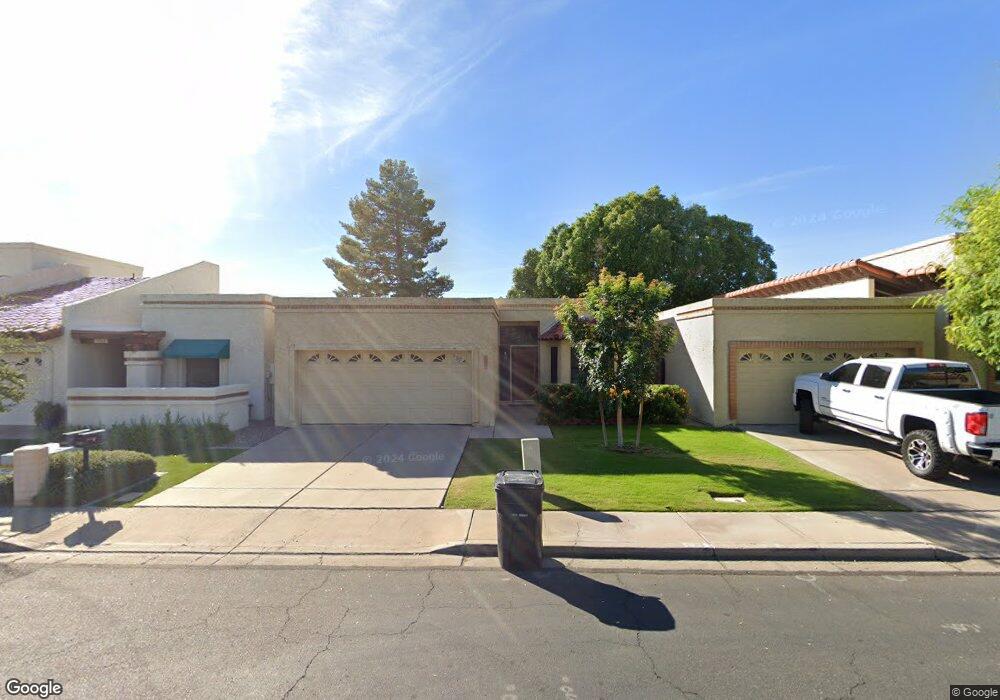
2023 W Nopal Ave Mesa, AZ 85202
Dobson NeighborhoodEstimated Value: $367,960 - $521,000
--
Bed
2
Baths
1,798
Sq Ft
$255/Sq Ft
Est. Value
About This Home
This home is located at 2023 W Nopal Ave, Mesa, AZ 85202 and is currently estimated at $458,990, approximately $255 per square foot. 2023 W Nopal Ave is a home located in Maricopa County with nearby schools including Franklin at Brimhall Elementary School, Franklin Accelerated Academy Jordan Campus, and Washington Elementary School.
Ownership History
Date
Name
Owned For
Owner Type
Purchase Details
Closed on
May 7, 2019
Sold by
Galusha Linda
Bought by
Linda Galusha Living Trust
Current Estimated Value
Purchase Details
Closed on
Oct 1, 1996
Sold by
Pringle Stephen C
Bought by
Galusha Linda Mercer
Home Financials for this Owner
Home Financials are based on the most recent Mortgage that was taken out on this home.
Original Mortgage
$88,000
Outstanding Balance
$8,281
Interest Rate
8.37%
Mortgage Type
New Conventional
Estimated Equity
$450,709
Purchase Details
Closed on
Mar 23, 1995
Sold by
Menzel David P and Menzel Barbara G
Bought by
Pringle Stephen C
Home Financials for this Owner
Home Financials are based on the most recent Mortgage that was taken out on this home.
Original Mortgage
$95,950
Interest Rate
8.6%
Mortgage Type
New Conventional
Create a Home Valuation Report for This Property
The Home Valuation Report is an in-depth analysis detailing your home's value as well as a comparison with similar homes in the area
Home Values in the Area
Average Home Value in this Area
Purchase History
| Date | Buyer | Sale Price | Title Company |
|---|---|---|---|
| Linda Galusha Living Trust | -- | None Available | |
| Galusha Linda Mercer | $111,000 | Stewart Title & Trust | |
| Pringle Stephen C | $101,000 | Lawyers Title |
Source: Public Records
Mortgage History
| Date | Status | Borrower | Loan Amount |
|---|---|---|---|
| Open | Galusha Linda Mercer | $88,000 | |
| Previous Owner | Pringle Stephen C | $95,950 |
Source: Public Records
Tax History Compared to Growth
Tax History
| Year | Tax Paid | Tax Assessment Tax Assessment Total Assessment is a certain percentage of the fair market value that is determined by local assessors to be the total taxable value of land and additions on the property. | Land | Improvement |
|---|---|---|---|---|
| 2025 | $1,452 | $17,488 | -- | -- |
| 2024 | $1,468 | $16,656 | -- | -- |
| 2023 | $1,468 | $31,570 | $6,310 | $25,260 |
| 2022 | $1,436 | $23,670 | $4,730 | $18,940 |
| 2021 | $1,475 | $22,330 | $4,460 | $17,870 |
| 2020 | $1,456 | $21,520 | $4,300 | $17,220 |
| 2019 | $1,349 | $19,920 | $3,980 | $15,940 |
| 2018 | $1,288 | $18,880 | $3,770 | $15,110 |
| 2017 | $1,247 | $16,630 | $3,320 | $13,310 |
| 2016 | $1,224 | $15,670 | $3,130 | $12,540 |
| 2015 | $1,156 | $14,370 | $2,870 | $11,500 |
Source: Public Records
Map
Nearby Homes
- 2043 W Nopal Ave
- 2719 S Santa Barbara
- 1910 W Onza Ave
- 2637 S El Paradiso
- 2554 S Salida Del Sol
- 2030 W Portobello Ave
- 2722 S Pennington
- 2958 S El Paradiso
- 2309 W Naranja Ave
- 1853 W Plata Ave
- 2937 S Pennington
- 2524 S El Paradiso Unit 22
- 2524 S El Paradiso Unit 32
- 2524 S El Paradiso Unit 50
- 1639 W Nido Ave
- 2552 S Playa
- 1555 W Naranja Ave
- 2334 W Peralta Ave
- 1531 W Naranja Ave
- 2334 W Lobo Ave
- 2027 W Nopal Ave
- 2019 W Nopal Ave
- 2047 W Nopal Ave
- 2015 W Nopal Ave
- 2031 W Nopal Ave
- 2035 W Nopal Ave
- 2013 W Nopal Ave
- 2011 W Nopal Ave
- 2028 W Nopal Ave
- 2763 S Santa Barbara
- 2763 S Santa Barbara
- 2032 W Nopal Ave
- 2039 W Nopal Ave
- 2036 W Nopal Ave
- 2759 S Santa Barbara
- 2040 W Nopal Ave
- 2755 S Santa Barbara
- 2044 W Nopal Ave
- 2748 S Santa Barbara
- 2751 S Santa Barbara