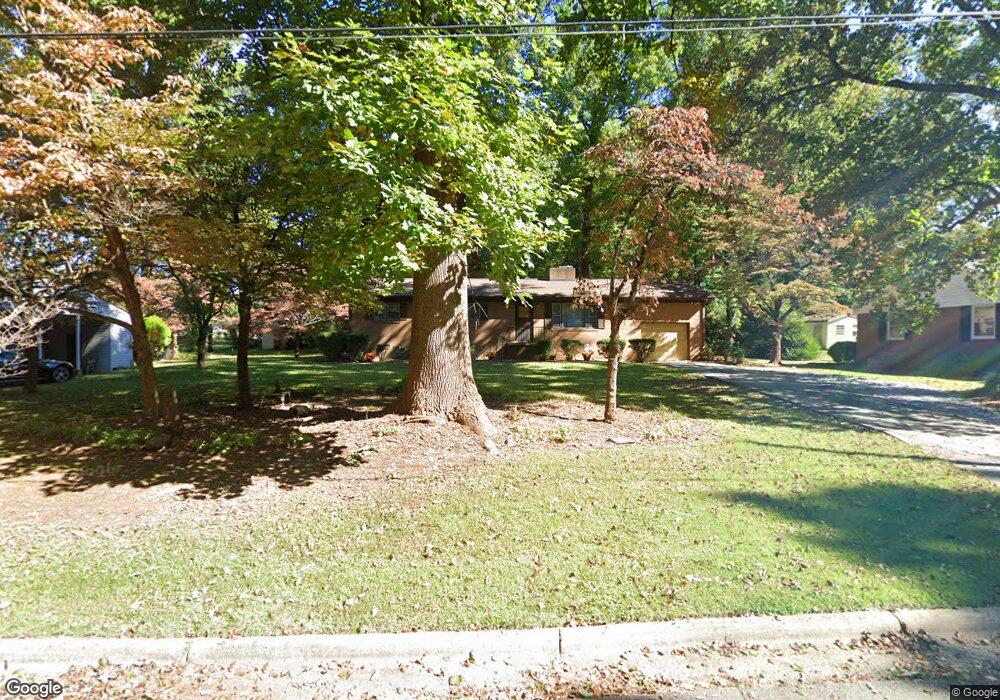
2023 Wesley Dr High Point, NC 27260
Greater High Point NeighborhoodEstimated Value: $108,000 - $181,250
3
Beds
2
Baths
1,300
Sq Ft
$119/Sq Ft
Est. Value
About This Home
This home is located at 2023 Wesley Dr, High Point, NC 27260 and is currently estimated at $154,063, approximately $118 per square foot. 2023 Wesley Dr is a home located in Guilford County with nearby schools including Fairview Elementary School, Ferndale Middle School, and High Point Central High School.
Ownership History
Date
Name
Owned For
Owner Type
Purchase Details
Closed on
Jan 14, 2009
Sold by
Garner Gale R and Garner Martha P
Bought by
J Garner Properties Llc
Current Estimated Value
Home Financials for this Owner
Home Financials are based on the most recent Mortgage that was taken out on this home.
Original Mortgage
$65,787
Interest Rate
5.48%
Mortgage Type
Purchase Money Mortgage
Purchase Details
Closed on
May 28, 2008
Sold by
Hud
Bought by
Garner Gale R and Garner Martha P
Purchase Details
Closed on
Oct 5, 2007
Sold by
Smith Gregory G and Treece Amy D
Bought by
Hud
Purchase Details
Closed on
Mar 31, 1999
Sold by
Seward William Jennings and Seward Elten E
Bought by
Treece Amy and Smith Gregory G
Home Financials for this Owner
Home Financials are based on the most recent Mortgage that was taken out on this home.
Original Mortgage
$86,912
Interest Rate
6.82%
Mortgage Type
FHA
Create a Home Valuation Report for This Property
The Home Valuation Report is an in-depth analysis detailing your home's value as well as a comparison with similar homes in the area
Home Values in the Area
Average Home Value in this Area
Purchase History
| Date | Buyer | Sale Price | Title Company |
|---|---|---|---|
| J Garner Properties Llc | $81,500 | None Available | |
| Garner Gale R | -- | None Available | |
| Hud | $94,430 | None Available | |
| Treece Amy | $87,000 | -- |
Source: Public Records
Mortgage History
| Date | Status | Borrower | Loan Amount |
|---|---|---|---|
| Closed | J Garner Properties Llc | $65,787 | |
| Previous Owner | Treece Amy | $86,912 |
Source: Public Records
Tax History Compared to Growth
Tax History
| Year | Tax Paid | Tax Assessment Tax Assessment Total Assessment is a certain percentage of the fair market value that is determined by local assessors to be the total taxable value of land and additions on the property. | Land | Improvement |
|---|---|---|---|---|
| 2025 | $965 | $70,000 | $7,000 | $63,000 |
| 2024 | $965 | $70,000 | $7,000 | $63,000 |
| 2023 | $965 | $70,000 | $7,000 | $63,000 |
| 2022 | $944 | $70,000 | $7,000 | $63,000 |
| 2021 | $858 | $62,300 | $6,000 | $56,300 |
| 2020 | $858 | $62,300 | $6,000 | $56,300 |
| 2019 | $858 | $62,300 | $0 | $0 |
| 2018 | $854 | $62,300 | $0 | $0 |
| 2017 | $858 | $62,300 | $0 | $0 |
| 2016 | $951 | $67,800 | $0 | $0 |
| 2015 | $956 | $67,800 | $0 | $0 |
| 2014 | $972 | $67,800 | $0 | $0 |
Source: Public Records
Map
Nearby Homes