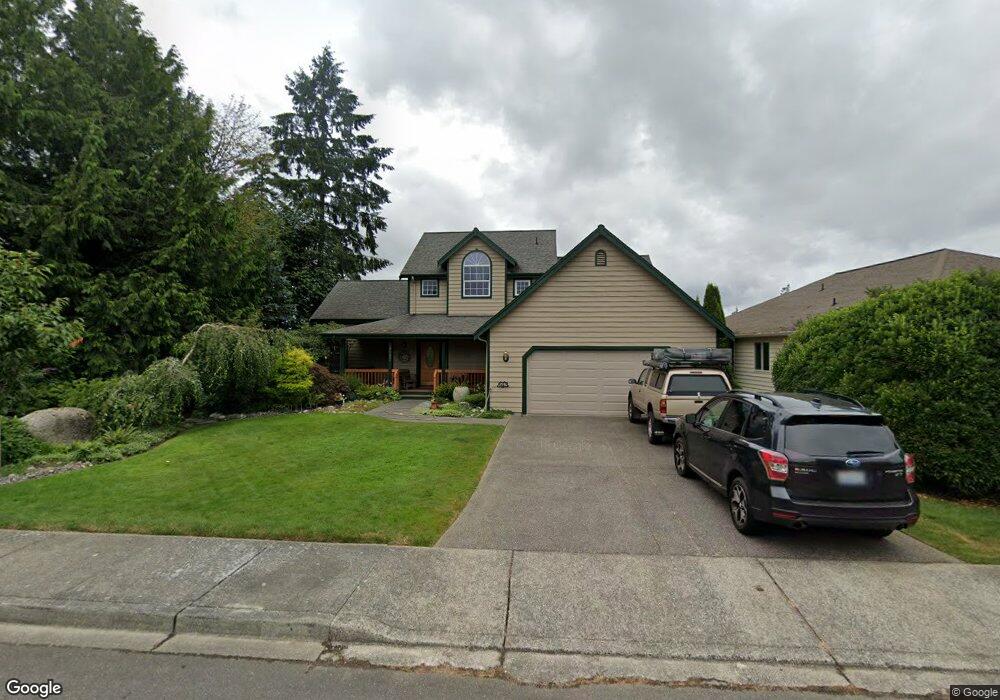
20235 12th Ave NE Poulsbo, WA 98370
Estimated Value: $672,000 - $727,000
3
Beds
3
Baths
1,938
Sq Ft
$357/Sq Ft
Est. Value
About This Home
This home is located at 20235 12th Ave NE, Poulsbo, WA 98370 and is currently estimated at $691,148, approximately $356 per square foot. 20235 12th Ave NE is a home located in Kitsap County with nearby schools including Poulsbo Elementary School, Poulsbo Middle School, and North Kitsap High School.
Ownership History
Date
Name
Owned For
Owner Type
Purchase Details
Closed on
Jan 12, 1998
Sold by
Dj Construction Ltd
Bought by
Christofferson Daniel G
Current Estimated Value
Home Financials for this Owner
Home Financials are based on the most recent Mortgage that was taken out on this home.
Original Mortgage
$181,280
Outstanding Balance
$31,462
Interest Rate
7.14%
Mortgage Type
VA
Estimated Equity
$653,297
Purchase Details
Closed on
Jun 16, 1997
Sold by
Wuensch Robert H and Wuensch Deborah L
Bought by
Glispin Alfred J and Glispin Anita K
Home Financials for this Owner
Home Financials are based on the most recent Mortgage that was taken out on this home.
Original Mortgage
$159,660
Interest Rate
7.94%
Create a Home Valuation Report for This Property
The Home Valuation Report is an in-depth analysis detailing your home's value as well as a comparison with similar homes in the area
Home Values in the Area
Average Home Value in this Area
Purchase History
| Date | Buyer | Sale Price | Title Company |
|---|---|---|---|
| Christofferson Daniel G | $176,000 | Land Title Company | |
| Glispin Alfred J | $199,583 | Land Title Company |
Source: Public Records
Mortgage History
| Date | Status | Borrower | Loan Amount |
|---|---|---|---|
| Open | Christofferson Daniel G | $181,280 | |
| Previous Owner | Glispin Alfred J | $159,660 |
Source: Public Records
Tax History Compared to Growth
Tax History
| Year | Tax Paid | Tax Assessment Tax Assessment Total Assessment is a certain percentage of the fair market value that is determined by local assessors to be the total taxable value of land and additions on the property. | Land | Improvement |
|---|---|---|---|---|
| 2026 | $5,674 | $632,270 | $201,080 | $431,190 |
| 2025 | $5,674 | $632,270 | $201,080 | $431,190 |
| 2024 | $5,252 | $602,650 | $166,530 | $436,120 |
| 2023 | $5,342 | $602,650 | $166,530 | $436,120 |
| 2022 | $4,748 | $509,400 | $144,560 | $364,840 |
| 2021 | $4,593 | $456,610 | $129,520 | $327,090 |
| 2020 | $4,465 | $436,160 | $123,740 | $312,420 |
| 2019 | $4,190 | $409,200 | $115,650 | $293,550 |
| 2018 | $3,922 | $325,440 | $90,670 | $234,770 |
| 2017 | $3,740 | $325,440 | $90,670 | $234,770 |
| 2016 | $3,851 | $308,680 | $90,670 | $218,010 |
| 2015 | $3,727 | $300,290 | $90,670 | $209,620 |
| 2014 | -- | $288,550 | $90,670 | $197,880 |
| 2013 | -- | $288,550 | $90,670 | $197,880 |
Source: Public Records
Map
Nearby Homes
- 1343 Lena Place NE
- 20165 Bue Rund Loop NE
- 1257 Cameo Ct NE
- 1711 NE Outlook Way
- 1330 NE Watland St
- 456 Little Valley Rd NE
- 20248 Pugh Rd NE
- 20274 Pugh Rd NE
- 20050 Vikings Crest Loop NE Unit 2-301
- 20145 Vikings Crest Loop NE Unit 3-204
- 20249 State Highway 305 NE
- 19370 NE Larson Ct
- 1754 NE Mesford Rd Unit 12
- 1754 NE Mesford Rd Unit 28
- 19795 4th Ave NE
- 123 Pugh Rd NE
- 0 Bond Rd NE
- 2496 NE Ariel Ct
- 2416 NE Dynasty Dr
- 20065 Regin Ct NE
- 1389 Lena Place NE
- 1365 Lena Place NE
- 1350 Forest Rock Ln NE
- 20240 12th Ave NE
- 20218 12th Ave NE
- 20246 12th Ave NE
- 1326 Forest Rock Ln NE
- 20295 12th Ave NE
- 1383 Forest Rock Ln NE
- 20295 12th Ave NE
- 20262 12th Ave NE
- 1413 Forest Rock Ln NE
- 1370 Lena Place NE
- 1331 Lena Place NE
- 20282 12th Ave NE
- 1331 NE Forest Rock Ln
- 1300 Forest Rock Ln NE
- 1311 Forest Rock Ln NE
- 20154 12th Ave NE
- 1374 Lena Place NE