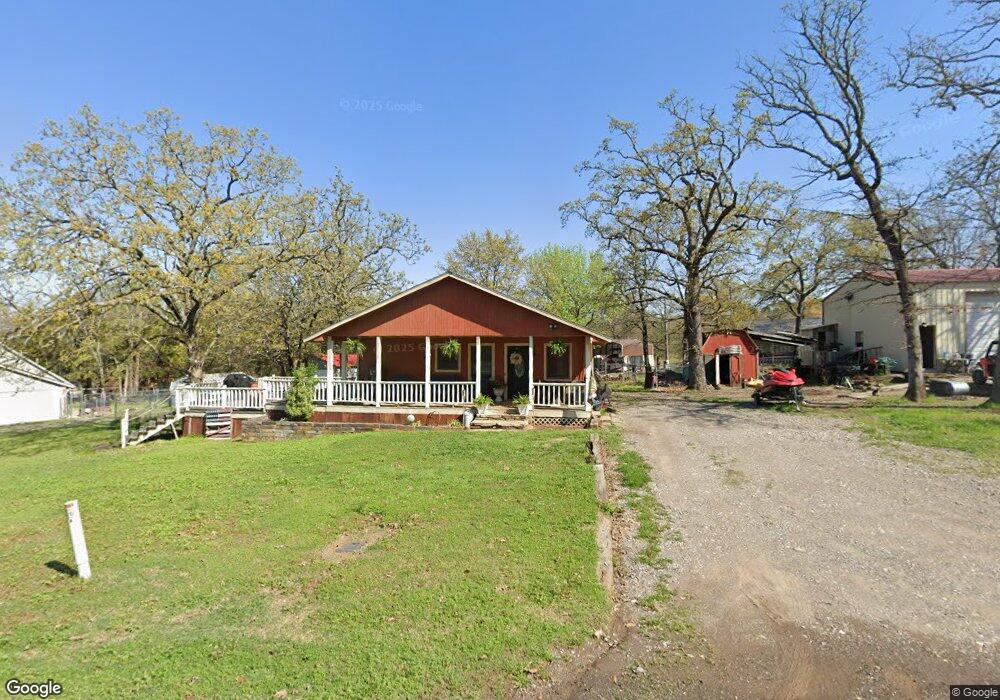
20238 W Deer Run Cookson, OK 74427
Estimated Value: $168,000 - $273,000
2
Beds
1
Bath
1,200
Sq Ft
$167/Sq Ft
Est. Value
About This Home
This home is located at 20238 W Deer Run, Cookson, OK 74427 and is currently estimated at $199,835, approximately $166 per square foot. 20238 W Deer Run is a home located in Cherokee County.
Ownership History
Date
Name
Owned For
Owner Type
Purchase Details
Closed on
Feb 24, 2015
Sold by
Parker Michael and Parker Stephania
Bought by
Parker Michael and Parker Stephania
Current Estimated Value
Home Financials for this Owner
Home Financials are based on the most recent Mortgage that was taken out on this home.
Original Mortgage
$30,000
Interest Rate
3.68%
Mortgage Type
Purchase Money Mortgage
Purchase Details
Closed on
May 30, 2007
Sold by
Kirby James D and Shope Edna E
Bought by
Parker Michael A and Ashmore Alfred G
Home Financials for this Owner
Home Financials are based on the most recent Mortgage that was taken out on this home.
Original Mortgage
$40,800
Interest Rate
6.15%
Mortgage Type
New Conventional
Purchase Details
Closed on
Aug 18, 2003
Sold by
Sally Ralph L and Sally Parker
Bought by
James Kirby and Edna Shope
Purchase Details
Closed on
Feb 12, 2003
Sold by
Sharon Parker
Bought by
Ralph L Parker
Create a Home Valuation Report for This Property
The Home Valuation Report is an in-depth analysis detailing your home's value as well as a comparison with similar homes in the area
Home Values in the Area
Average Home Value in this Area
Purchase History
| Date | Buyer | Sale Price | Title Company |
|---|---|---|---|
| Parker Michael | -- | None Available | |
| Ashmore Alfred G | -- | None Available | |
| Parker Michael A | $68,000 | None Available | |
| James Kirby | $64,000 | -- | |
| Ralph L Parker | -- | -- |
Source: Public Records
Mortgage History
| Date | Status | Borrower | Loan Amount |
|---|---|---|---|
| Closed | Ashmore Alfred G | $30,000 | |
| Previous Owner | Parker Michael A | $40,800 |
Source: Public Records
Tax History Compared to Growth
Tax History
| Year | Tax Paid | Tax Assessment Tax Assessment Total Assessment is a certain percentage of the fair market value that is determined by local assessors to be the total taxable value of land and additions on the property. | Land | Improvement |
|---|---|---|---|---|
| 2024 | $1,059 | $13,267 | $2,255 | $11,012 |
| 2023 | $1,059 | $13,267 | $2,255 | $11,012 |
| 2022 | $971 | $13,267 | $2,255 | $11,012 |
| 2021 | $1,057 | $13,267 | $2,255 | $11,012 |
| 2020 | $1,062 | $13,069 | $2,255 | $10,814 |
| 2019 | $1,010 | $12,602 | $2,174 | $10,428 |
| 2018 | $958 | $12,002 | $2,071 | $9,931 |
| 2017 | $914 | $11,430 | $1,972 | $9,458 |
| 2016 | $869 | $10,885 | $1,204 | $9,681 |
| 2015 | $814 | $10,368 | $1,098 | $9,270 |
| 2014 | $774 | $9,874 | $1,201 | $8,673 |
Source: Public Records
Map
Nearby Homes
- 32256 S 528 Rd
- 32174 S Boulder Rd
- 19766 W 901 Rd
- 19542 W 905 Rd
- 32340 S Skyline Dr
- 31720 S 533 Rd
- 31663 S 530 Rd
- 21331 W Cookson Bend Rd
- 32548 S Cookson Bluff Rd
- 19460 W 925 Rd
- 32617 S 543 Rd
- 20717 W 888 Rd
- 18475 W Lakewood Dr
- 33959 S Terrapin Creek Rd
- 18697 W 903 Rd
- 33966 S Plymouth Rock Rd
- 34021 S Terrapin Creek Rd
- 19690 W 892 Rd
- 19983 W Chicken Creek Rd
- 34150 S Terrapin Creek Rd
- 20224 W Deer Run
- 0 W Deer Run
- 20231 W Cherokee Trail
- 20217 W Cherokee Trail
- 20241 W Deer Run
- 20210 W Deer Run
- 32344 S Hickory Dr
- 12 & 13 Cherokee Trail
- 32316 S Hickory Dr
- 32362 S Hickory Dr
- 20188 W Coon Hollow
- 20240 W Coon Hollow
- 20206 W Coon Hollow Rd
- TBD W Coon Hollow Rd
- 20203 W Cherokee Trail
- 20385 W Cherokee Trail
- 20130 W Deer Run
- 20282 W Cherokee Trail
- 20211 W Coon Hollow
- 20225 W Coon Hollow