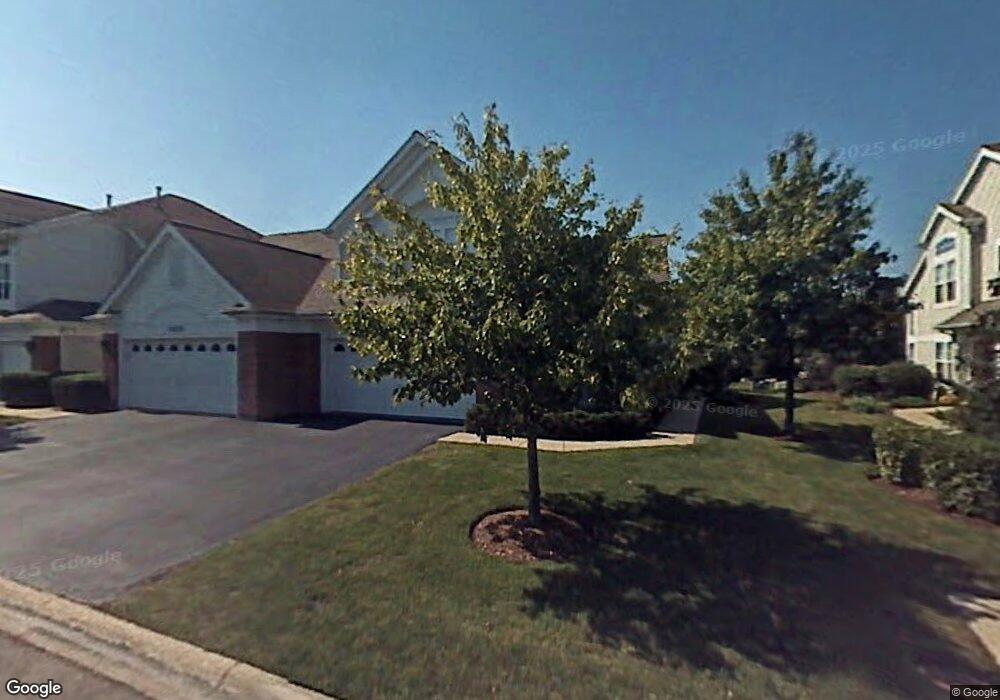
2024 Avalon Ct Unit 216M202 Northbrook, IL 60062
Estimated Value: $420,000 - $485,000
3
Beds
--
Bath
1,728
Sq Ft
$266/Sq Ft
Est. Value
About This Home
This home is located at 2024 Avalon Ct Unit 216M202, Northbrook, IL 60062 and is currently estimated at $459,529, approximately $265 per square foot. 2024 Avalon Ct Unit 216M202 is a home located in Cook County with nearby schools including Henry Winkelman Elementary School, Field Middle School, and Glenbrook South High School.
Ownership History
Date
Name
Owned For
Owner Type
Purchase Details
Closed on
May 10, 2022
Sold by
Levin Yakov and Levin Alla
Bought by
Ponferrada Mary Anne
Current Estimated Value
Home Financials for this Owner
Home Financials are based on the most recent Mortgage that was taken out on this home.
Original Mortgage
$365,500
Outstanding Balance
$343,902
Interest Rate
4.25%
Mortgage Type
New Conventional
Estimated Equity
$115,627
Purchase Details
Closed on
Jun 1, 1998
Sold by
Glenview Place Llc
Bought by
Levin Yakov and Duyunova Alla
Home Financials for this Owner
Home Financials are based on the most recent Mortgage that was taken out on this home.
Original Mortgage
$163,200
Interest Rate
7%
Create a Home Valuation Report for This Property
The Home Valuation Report is an in-depth analysis detailing your home's value as well as a comparison with similar homes in the area
Home Values in the Area
Average Home Value in this Area
Purchase History
| Date | Buyer | Sale Price | Title Company |
|---|---|---|---|
| Ponferrada Mary Anne | $430,000 | None Listed On Document | |
| Levin Yakov | $211,000 | Ticor Title |
Source: Public Records
Mortgage History
| Date | Status | Borrower | Loan Amount |
|---|---|---|---|
| Open | Ponferrada Mary Anne | $365,500 | |
| Previous Owner | Levin Yakov | $163,200 |
Source: Public Records
Tax History Compared to Growth
Tax History
| Year | Tax Paid | Tax Assessment Tax Assessment Total Assessment is a certain percentage of the fair market value that is determined by local assessors to be the total taxable value of land and additions on the property. | Land | Improvement |
|---|---|---|---|---|
| 2024 | $7,687 | $35,465 | $5,027 | $30,438 |
| 2023 | $6,316 | $35,465 | $5,027 | $30,438 |
| 2022 | $6,316 | $35,465 | $5,027 | $30,438 |
| 2021 | $5,486 | $27,947 | $5,483 | $22,464 |
| 2020 | $5,328 | $27,947 | $5,483 | $22,464 |
| 2019 | $5,272 | $31,219 | $5,483 | $25,736 |
| 2018 | $4,781 | $26,901 | $4,798 | $22,103 |
| 2017 | $4,668 | $26,901 | $4,798 | $22,103 |
| 2016 | $4,822 | $26,901 | $4,798 | $22,103 |
| 2015 | $4,574 | $23,917 | $3,884 | $20,033 |
| 2014 | $4,469 | $23,917 | $3,884 | $20,033 |
| 2013 | $4,352 | $23,917 | $3,884 | $20,033 |
Source: Public Records
Map
Nearby Homes
- 2032 Avalon Ct Unit 221J2
- 2038 Cambria Ct Unit 145J2
- 2073 Cambria Ct Unit 94K20
- 4534 Concord Ln Unit 52L45
- 3256 Sanders Rd Unit 4E
- 3856 S Parkway Dr Unit 2A
- 2308 Indian Ridge Dr
- 3256 Westview Dr
- 4603 Jenna Rd
- 3190 Landwehr Rd
- 4524 S Seminole Dr
- 4150 Russet Way
- 4035 Crestwood Dr
- 1594 Portage Run
- 2019 E Chinkapin Oak Dr
- 4250 Meadowview Dr
- 2024 E Wintergreen Ave
- 940 E Old Willow Rd Unit 305
- 3026 Glenway Dr
- 1640 Barry Ln
- 2036 Avalon Ct Unit 223K203
- 2028 Avalon Ct Unit 222H202
- 2020 Avalon Ct Unit 215L2
- 2016 Avalon Ct Unit 214K201
- 2012 Avalon Ct Unit 213K201
- 2040 Avalon Ct Unit 224K204
- 2044 Avalon Ct Unit 225H204
- 2008 Avalon Ct Unit 212L200
- 2048 Avalon Ct Unit 226J204
- 2071 Avalon Ct Unit 175H207
- 2075 Avalon Ct Unit 176J2075
- 2075 Avalon Ct Unit 17-6
- 2075 Avalon Ct Unit J
- 2079 Avalon Ct Unit 174L2
- 2004 Avalon Ct Unit 211M200
- 2083 Avalon Ct Unit 173
- 2083 Avalon Ct Unit 173K208
- 2003 Avalon Ct Unit 204H2
- 2003 Avalon Ct Unit H
- 2091 Avalon Ct Unit 171J209