2024 Burwell Dr Unit B Columbus, OH 43209
Estimated Value: $116,000 - $123,304
2
Beds
2
Baths
882
Sq Ft
$136/Sq Ft
Est. Value
About This Home
This home is located at 2024 Burwell Dr Unit B, Columbus, OH 43209 and is currently estimated at $119,826, approximately $135 per square foot. 2024 Burwell Dr Unit B is a home located in Franklin County with nearby schools including Easthaven Elementary School, Yorktown Middle School, and Independence High School.
Ownership History
Date
Name
Owned For
Owner Type
Purchase Details
Closed on
Jan 5, 2024
Sold by
Smith-Higbie Paris and Smith-Higbie Rae
Bought by
Evans Sydney
Current Estimated Value
Home Financials for this Owner
Home Financials are based on the most recent Mortgage that was taken out on this home.
Original Mortgage
$111,870
Outstanding Balance
$109,912
Interest Rate
6.95%
Mortgage Type
New Conventional
Estimated Equity
$9,914
Purchase Details
Closed on
Feb 1, 2005
Sold by
Moorehead Gladys M
Bought by
Smith Higbie Paris and Smith Higbie Rae
Home Financials for this Owner
Home Financials are based on the most recent Mortgage that was taken out on this home.
Original Mortgage
$52,000
Interest Rate
7.12%
Mortgage Type
Adjustable Rate Mortgage/ARM
Purchase Details
Closed on
May 29, 1985
Bought by
Moorehead Gladys M
Purchase Details
Closed on
Jun 1, 1984
Purchase Details
Closed on
Jul 1, 1980
Create a Home Valuation Report for This Property
The Home Valuation Report is an in-depth analysis detailing your home's value as well as a comparison with similar homes in the area
Home Values in the Area
Average Home Value in this Area
Purchase History
| Date | Buyer | Sale Price | Title Company |
|---|---|---|---|
| Evans Sydney | $113,000 | Crown Search Box | |
| Smith Higbie Paris | $52,000 | Chicago Tit | |
| Moorehead Gladys M | $35,500 | -- | |
| -- | $32,500 | -- | |
| -- | $33,000 | -- |
Source: Public Records
Mortgage History
| Date | Status | Borrower | Loan Amount |
|---|---|---|---|
| Open | Evans Sydney | $111,870 | |
| Previous Owner | Smith Higbie Paris | $52,000 |
Source: Public Records
Tax History Compared to Growth
Tax History
| Year | Tax Paid | Tax Assessment Tax Assessment Total Assessment is a certain percentage of the fair market value that is determined by local assessors to be the total taxable value of land and additions on the property. | Land | Improvement |
|---|---|---|---|---|
| 2024 | $1,344 | $29,330 | $5,250 | $24,080 |
| 2023 | $1,327 | $29,330 | $5,250 | $24,080 |
| 2022 | $1,073 | $17,370 | $2,210 | $15,160 |
| 2021 | $1,075 | $17,370 | $2,210 | $15,160 |
| 2020 | $1,076 | $17,370 | $2,210 | $15,160 |
| 2019 | $1,012 | $13,860 | $1,750 | $12,110 |
| 2018 | $959 | $13,860 | $1,750 | $12,110 |
| 2017 | $912 | $13,860 | $1,750 | $12,110 |
| 2016 | $992 | $13,860 | $2,520 | $11,340 |
| 2015 | $907 | $13,860 | $2,520 | $11,340 |
| 2014 | $859 | $13,860 | $2,520 | $11,340 |
| 2013 | $521 | $15,400 | $2,800 | $12,600 |
Source: Public Records
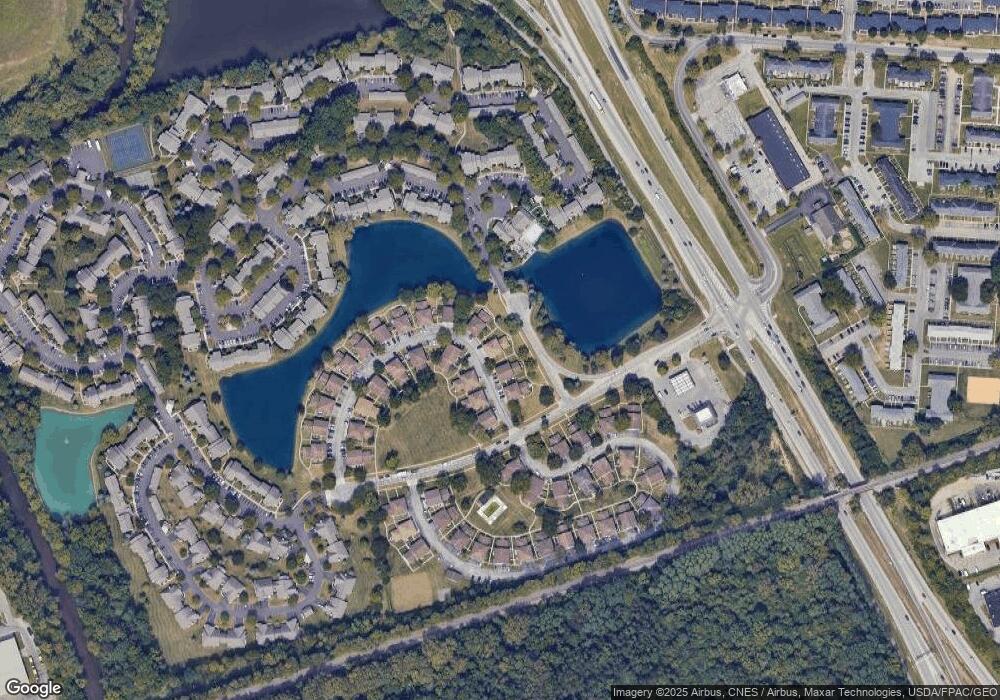
Map
Nearby Homes
- 2395 Briers Dr
- 2468 Natchez Dr Unit D
- 2424 Ravenel Dr
- 2639 Halleck Dr
- 3050 Peters St
- 2846 Petzinger Rd Unit 70
- 2664 Sonata Dr
- 2866 Kingsrowe Ct Unit 38
- 1782 Newfield Rd
- 1677 Kenview Rd
- 2567 Scottwood Rd
- 1866 Queensrowe Ct
- 3036 Wadsworth Ct
- 3038 Wadsworth Ct
- 2866 Landon Dr
- 2894 Landon Dr
- 1855 Zettler Rd
- 1634 S James Rd
- 2957 Ivanhoe Dr
- 1778 Quigley Rd
- 2024 Burwell Dr Unit 47B
- 2022 Burwell Dr
- 2022 Burwell Dr Unit A
- 2020 Burwell Dr Unit 47C
- 2020 Burwell Dr Unit C
- 2018 Burwell Dr
- 2026 Burwell Dr
- 2026 Burwell Dr Unit B
- 2026 Burwell Dr Unit C
- 2032 Burwell Dr
- 2028 Burwell Dr Unit 46A
- 2030 Burwell Dr
- 2014 Burwell Dr Unit 48B
- 2016 Burwell Dr Unit 48D
- 2016 Burwell Dr Unit D
- 2019 Burwell Dr
- 2012 Burwell Dr Unit 48A
- 2010 Burwell Dr Unit 48C
- 2036 Burwell Dr
- 2036 Burwell Dr Unit C