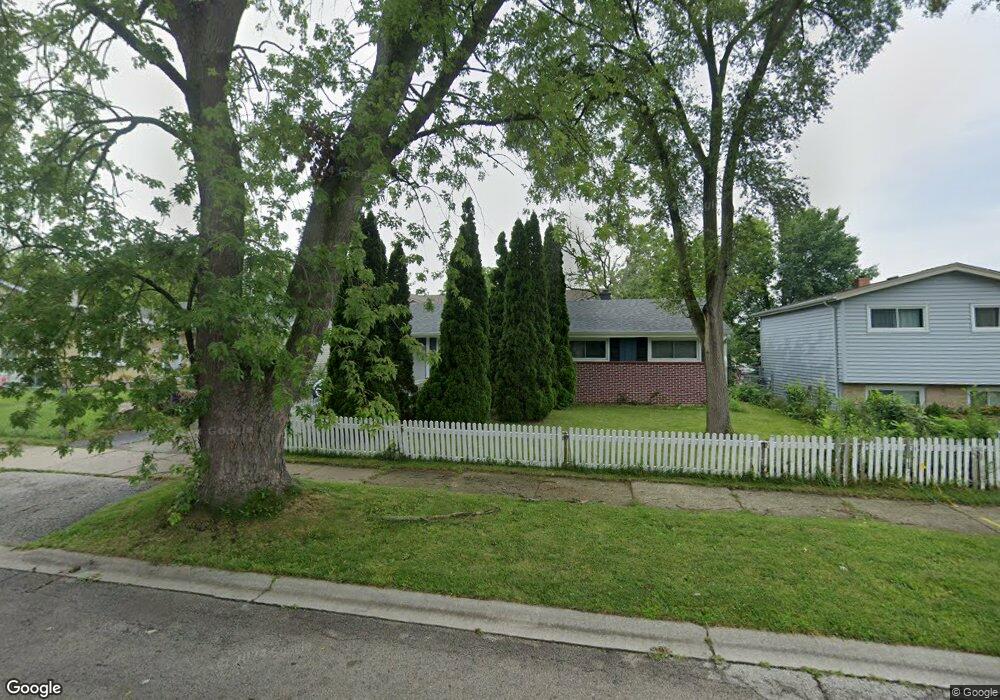
2024 Irving Pkwy Waukegan, IL 60087
Estimated Value: $243,529 - $265,000
3
Beds
2
Baths
936
Sq Ft
$276/Sq Ft
Est. Value
About This Home
This home is located at 2024 Irving Pkwy, Waukegan, IL 60087 and is currently estimated at $258,382, approximately $276 per square foot. 2024 Irving Pkwy is a home located in Lake County with nearby schools including H R McCall Elementary School, Jack Benny Middle School, and Waukegan High School.
Ownership History
Date
Name
Owned For
Owner Type
Purchase Details
Closed on
Oct 23, 2024
Sold by
Mcbride Manvin and Mcbride Lori
Bought by
Mcbride Manvin
Current Estimated Value
Purchase Details
Closed on
Jun 27, 2002
Sold by
Ocampo Jose Jesus and Ocampo Andrea G
Bought by
Mcbride Marvin and Mcbride Lori
Home Financials for this Owner
Home Financials are based on the most recent Mortgage that was taken out on this home.
Original Mortgage
$137,735
Interest Rate
6.7%
Mortgage Type
FHA
Purchase Details
Closed on
Nov 24, 1993
Sold by
Slicker Todd C and Slicker Juliann G
Bought by
Ocampo Jose Jesus and Martinez Andrea G
Home Financials for this Owner
Home Financials are based on the most recent Mortgage that was taken out on this home.
Original Mortgage
$101,918
Interest Rate
6.88%
Mortgage Type
FHA
Create a Home Valuation Report for This Property
The Home Valuation Report is an in-depth analysis detailing your home's value as well as a comparison with similar homes in the area
Home Values in the Area
Average Home Value in this Area
Purchase History
| Date | Buyer | Sale Price | Title Company |
|---|---|---|---|
| Mcbride Manvin | -- | None Listed On Document | |
| Mcbride Marvin | $140,000 | First American Title | |
| Ocampo Jose Jesus | $68,000 | -- |
Source: Public Records
Mortgage History
| Date | Status | Borrower | Loan Amount |
|---|---|---|---|
| Previous Owner | Mcbride Marvin | $137,735 | |
| Previous Owner | Ocampo Jose Jesus | $101,918 |
Source: Public Records
Tax History Compared to Growth
Tax History
| Year | Tax Paid | Tax Assessment Tax Assessment Total Assessment is a certain percentage of the fair market value that is determined by local assessors to be the total taxable value of land and additions on the property. | Land | Improvement |
|---|---|---|---|---|
| 2024 | $4,227 | $60,618 | $6,123 | $54,495 |
| 2023 | $3,354 | $53,348 | $5,911 | $47,437 |
| 2022 | $3,354 | $40,719 | $5,775 | $34,944 |
| 2021 | $3,467 | $39,683 | $5,628 | $34,055 |
| 2020 | $3,563 | $37,869 | $5,371 | $32,498 |
| 2019 | $3,686 | $35,929 | $5,096 | $30,833 |
| 2018 | $3,305 | $31,374 | $6,074 | $25,300 |
| 2017 | $3,292 | $29,515 | $5,714 | $23,801 |
| 2016 | $3,355 | $28,099 | $5,440 | $22,659 |
| 2015 | $3,277 | $25,769 | $4,989 | $20,780 |
| 2014 | $4,491 | $34,015 | $9,134 | $24,881 |
| 2012 | $5,199 | $35,348 | $9,492 | $25,856 |
Source: Public Records
Map
Nearby Homes
- 3411 N Lewis Ave
- 37966 N Cornell Rd
- 3211 Rugby Ct
- 1730 W Beach Rd
- 38683 N Lewis Ave
- 3101 Country Club Ln
- 38127 N Shore Ave
- 38362 N Manor Ave
- 11345 W Carnahan Ave
- 38697 N Cedar Ave
- 1636 Rice St
- 11342-11364 W Wadsworth Rd
- 37905 N Loyola Ave
- 12582 W Beach Rd
- 1612 Whitney St
- 38859 N Green Bay Rd
- 2613 N Lewis Ave
- 12312 W Audrey Ave
- 12640 W Wadsworth Rd
- 39113 N Green Bay Rd
- 2020 Irving Pkwy
- 2028 Irving Pkwy Unit 1
- 2016 Irving Pkwy
- 3521 Rock Pkwy
- 2012 Irving Pkwy
- 2025 Irving Pkwy
- 2019 Irving Pkwy
- 2029 Irving Pkwy
- 2017 Irving Pkwy
- 3511 Rock Pkwy
- 2008 Irving Pkwy
- 2013 Irving Pkwy
- 3532 Rock Pkwy
- 3528 Rock Pkwy
- 2009 Irving Pkwy
- 3524 Rock Pkwy
- 2004 Irving Pkwy
- 2020 Arthur Dr
- 2024 Arthur Dr
- 3520 Rock Pkwy