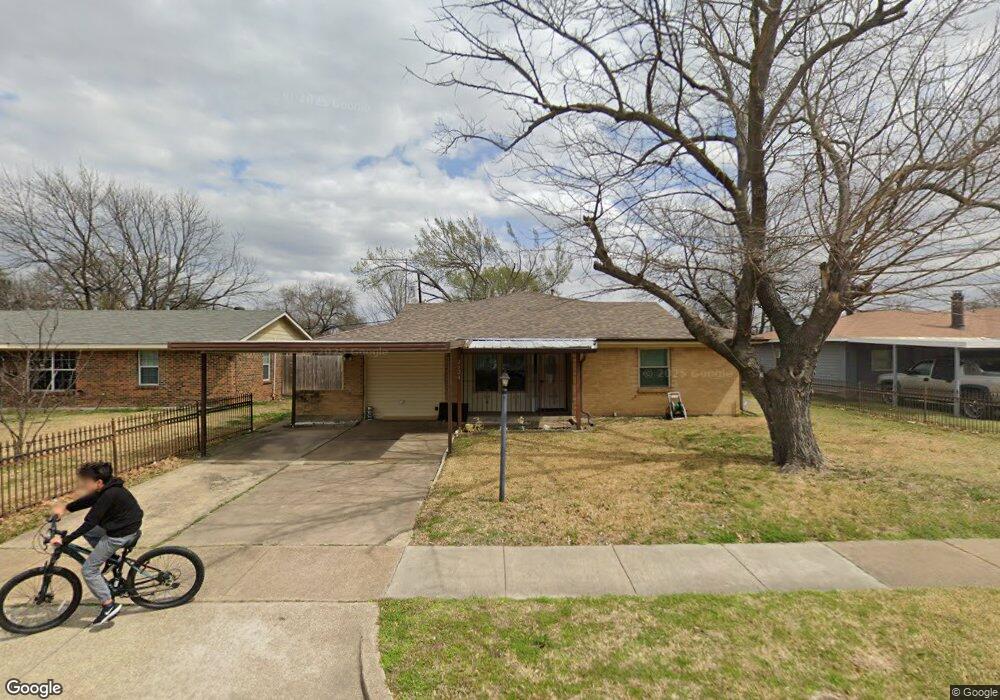
2024 Pyramid Dr Mesquite, TX 75149
Estimated Value: $236,046 - $250,000
3
Beds
2
Baths
1,356
Sq Ft
$179/Sq Ft
Est. Value
About This Home
This home is located at 2024 Pyramid Dr, Mesquite, TX 75149 and is currently estimated at $243,262, approximately $179 per square foot. 2024 Pyramid Dr is a home located in Dallas County with nearby schools including Mcwhorter Elementary School, Lanny Frasier Middle, and West Mesquite High School.
Ownership History
Date
Name
Owned For
Owner Type
Purchase Details
Closed on
Aug 28, 2015
Sold by
Lowe James and Lowe Nellie
Bought by
Frausto Roman Lona and Rangel Antonia Almendariz
Current Estimated Value
Home Financials for this Owner
Home Financials are based on the most recent Mortgage that was taken out on this home.
Original Mortgage
$80,100
Outstanding Balance
$32,339
Interest Rate
4.12%
Mortgage Type
New Conventional
Estimated Equity
$210,923
Purchase Details
Closed on
Oct 17, 2013
Sold by
Cruz Frank and Cruz Gloria
Bought by
Johnson Rodney E
Purchase Details
Closed on
Feb 14, 2012
Sold by
Leet Sheila Deon
Bought by
Lowe James and Lowe Nellie
Home Financials for this Owner
Home Financials are based on the most recent Mortgage that was taken out on this home.
Original Mortgage
$66,276
Interest Rate
3.34%
Purchase Details
Closed on
Jul 15, 2011
Sold by
Compton Ila Laverne
Bought by
Leet Sheila Deon
Create a Home Valuation Report for This Property
The Home Valuation Report is an in-depth analysis detailing your home's value as well as a comparison with similar homes in the area
Home Values in the Area
Average Home Value in this Area
Purchase History
| Date | Buyer | Sale Price | Title Company |
|---|---|---|---|
| Frausto Roman Lona | -- | Attorney | |
| Johnson Rodney E | -- | Rtt | |
| Lowe James | -- | Alamo Title Company | |
| Leet Sheila Deon | -- | None Available |
Source: Public Records
Mortgage History
| Date | Status | Borrower | Loan Amount |
|---|---|---|---|
| Open | Frausto Roman Lona | $80,100 | |
| Previous Owner | Lowe James | $66,276 |
Source: Public Records
Tax History Compared to Growth
Tax History
| Year | Tax Paid | Tax Assessment Tax Assessment Total Assessment is a certain percentage of the fair market value that is determined by local assessors to be the total taxable value of land and additions on the property. | Land | Improvement |
|---|---|---|---|---|
| 2025 | $6,093 | $262,640 | $55,000 | $207,640 |
| 2024 | $6,093 | $262,640 | $55,000 | $207,640 |
| 2023 | $6,093 | $243,450 | $40,000 | $203,450 |
| 2022 | $6,116 | $243,450 | $40,000 | $203,450 |
| 2021 | $4,859 | $184,250 | $30,000 | $154,250 |
| 2020 | $4,316 | $154,420 | $30,000 | $124,420 |
| 2019 | $4,494 | $154,420 | $30,000 | $124,420 |
| 2018 | $3,586 | $127,910 | $26,000 | $101,910 |
| 2017 | $3,197 | $114,110 | $15,000 | $99,110 |
| 2016 | $2,461 | $87,840 | $15,000 | $72,840 |
| 2015 | $410 | $67,560 | $15,000 | $52,560 |
| 2014 | $410 | $67,560 | $15,000 | $52,560 |
Source: Public Records
Map
Nearby Homes
- 1410 Athens Dr
- Lot 15 Central Park Ct
- Lot 14 Central Park Ct
- 11915 Carson Dr
- 1325 Woodcrest Dr
- 1222 Athens Dr
- 1229 Greenbrier Dr
- 1309 Woodcrest Dr
- 2429 Hickory Tree Rd
- 1905 Blossom Trail
- 1901 Blossom Trail
- 2441 Lindale Ln
- 1505 W Bruton Rd
- 2510 Lora Ln
- 1317 W Bruton Rd
- 2511 Lora Ln
- 1300 Develon Dr
- 1301 Cedarcrest Dr
- 1705 Magnolia Dr
- 2633 Dean St
- 2020 Pyramid Dr
- 2028 Pyramid Dr
- 2016 Pyramid Dr
- 2025 Narobi Place
- 2029 Narobi Place
- 2021 Narobi Place
- 2029 Pyramid Dr
- 2012 Pyramid Dr
- 2025 Pyramid Dr
- 2033 Pyramid Dr
- 2021 Pyramid Dr
- 2017 Narobi Place
- 2017 Pyramid Dr
- 1604 Edgemont Dr
- 2008 Pyramid Dr
- 1600 Edgemont Dr
- 1612 Edgemont Dr
- 1608 Edgemont Dr
- 2013 Narobi Place
- 1616 Edgemont Dr