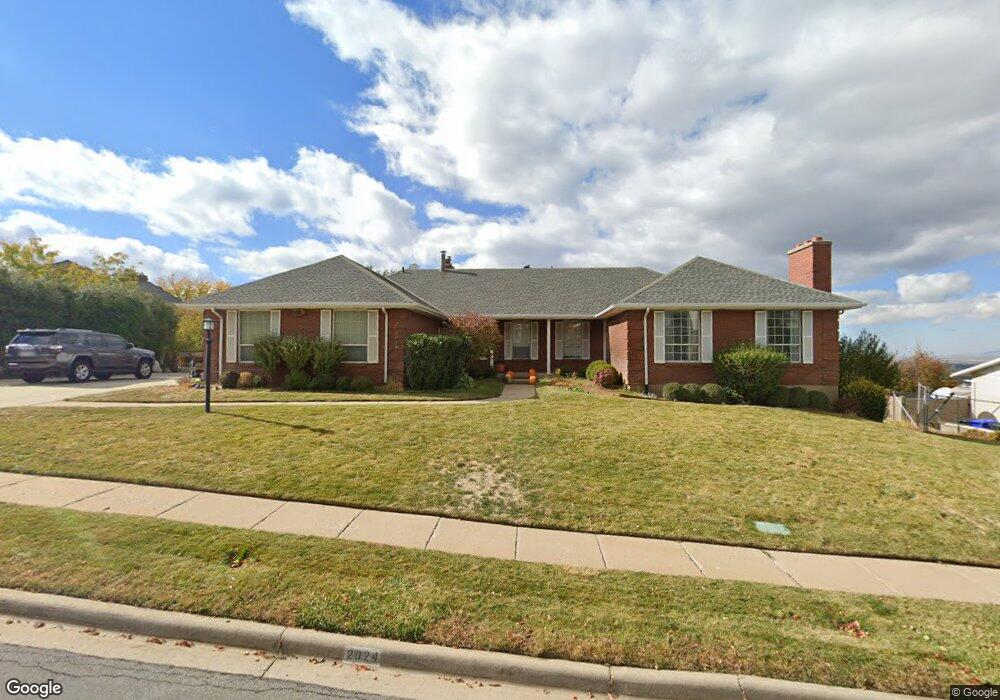
2024 S 850 E Bountiful, UT 84010
Estimated Value: $654,000 - $874,000
4
Beds
4
Baths
2,210
Sq Ft
$351/Sq Ft
Est. Value
About This Home
This home is located at 2024 S 850 E, Bountiful, UT 84010 and is currently estimated at $775,111, approximately $350 per square foot. 2024 S 850 E is a home located in Davis County with nearby schools including Muir School, Mueller Park Junior High School, and Bountiful High School.
Ownership History
Date
Name
Owned For
Owner Type
Purchase Details
Closed on
Sep 16, 2022
Sold by
Ashlyn Mckasson
Bought by
Mckasson Ashlyn and Mckasson Thomas Scott
Current Estimated Value
Home Financials for this Owner
Home Financials are based on the most recent Mortgage that was taken out on this home.
Original Mortgage
$560,000
Outstanding Balance
$533,730
Interest Rate
5.13%
Mortgage Type
New Conventional
Estimated Equity
$241,381
Purchase Details
Closed on
Aug 2, 2019
Sold by
Gillespie Elaina C and Thuryle Clyde Nelson Family Tr
Bought by
Gillespie Elaina C and Lloyd D Nelson Qtip Marital Tr
Purchase Details
Closed on
Aug 16, 2017
Sold by
Clyde Thuryle M
Bought by
Nelson Thuryle Clyde and Nelson Family Trust
Create a Home Valuation Report for This Property
The Home Valuation Report is an in-depth analysis detailing your home's value as well as a comparison with similar homes in the area
Purchase History
| Date | Buyer | Sale Price | Title Company |
|---|---|---|---|
| Mckasson Ashlyn | -- | Backman Title Services | |
| Mekasson Ashlyn | -- | Backman Title Services | |
| Gillespie Elaina C | -- | None Available | |
| Nelson Thuryle Clyde | -- | -- |
Source: Public Records
Mortgage History
| Date | Status | Borrower | Loan Amount |
|---|---|---|---|
| Open | Mekasson Ashlyn | $560,000 | |
| Closed | Mckasson Ashlyn | $560,000 |
Source: Public Records
Tax History
| Year | Tax Paid | Tax Assessment Tax Assessment Total Assessment is a certain percentage of the fair market value that is determined by local assessors to be the total taxable value of land and additions on the property. | Land | Improvement |
|---|---|---|---|---|
| 2025 | $4,674 | $423,500 | $175,800 | $247,700 |
| 2024 | $4,326 | $403,700 | $162,455 | $241,245 |
| 2023 | $4,238 | $719,000 | $304,671 | $414,329 |
| 2022 | $4,292 | $726,000 | $297,586 | $428,414 |
| 2021 | $3,869 | $552,000 | $244,150 | $307,850 |
| 2020 | $3,532 | $493,000 | $222,081 | $270,919 |
| 2019 | $3,601 | $479,000 | $196,811 | $282,189 |
| 2018 | $3,663 | $508,000 | $185,676 | $322,324 |
| 2016 | $3,307 | $249,150 | $68,474 | $180,676 |
| 2015 | $3,456 | $246,950 | $68,474 | $178,476 |
| 2014 | $3,012 | $219,463 | $68,474 | $150,989 |
| 2013 | -- | $163,782 | $66,961 | $96,821 |
Source: Public Records
Map
Nearby Homes
- 2136 S 900 E
- 831 E San Simeon Way S
- 761 San Simeon Way
- 994 Deborah Dr
- 1087 Arlington Way
- 1761 S Davis Blvd
- 1888 S 1150 E
- 1886 S Jeri Dr
- 631 E 1700 S
- 610 Meadowlark Ln
- 2053 S 350 E Unit 7
- 2059 S 350 E Unit 6
- 295 E 2050 S Unit 1
- 2046 S 350 E Unit 4
- 2038 S 350 E Unit 3
- 320 E 2100 S
- 0 Bountiful Blvd
- 296 E 2050 S Unit 2
- 775 E 1500 S
- 2292 S 250 E
Your Personal Tour Guide
Ask me questions while you tour the home.