Estimated Value: $376,884 - $495,000
4
Beds
2
Baths
1,800
Sq Ft
$241/Sq Ft
Est. Value
About This Home
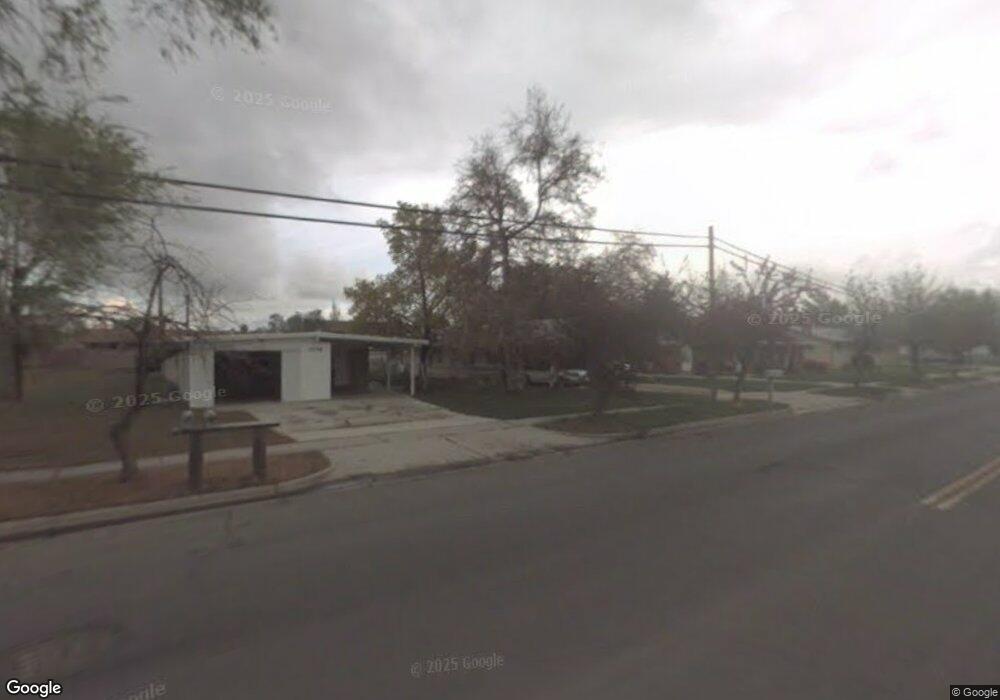
This home is located at 2024 W 4400 S, Roy, UT 84067 and is currently estimated at $433,721, approximately $240 per square foot. 2024 W 4400 S is a home with nearby schools including North Park School, Sand Ridge Junior High School, and Roy High School.
Ownership History
Date
Name
Owned For
Owner Type
Purchase Details
Closed on
Sep 29, 2020
Sold by
Kinney Shane R
Bought by
Kinney Shane R and Kinney Kristina S
Current Estimated Value
Home Financials for this Owner
Home Financials are based on the most recent Mortgage that was taken out on this home.
Original Mortgage
$173,000
Outstanding Balance
$153,874
Interest Rate
2.9%
Mortgage Type
New Conventional
Estimated Equity
$279,847
Purchase Details
Closed on
Nov 30, 2016
Sold by
Kinney Shanae R and The George R Kinney Trust
Bought by
Kinney Sharne R
Purchase Details
Closed on
Jul 30, 2008
Sold by
Grk Roy Llc
Bought by
Kinney George R
Purchase Details
Closed on
Dec 23, 2002
Sold by
Kinney George R
Bought by
Grk Roy Llc
Purchase Details
Closed on
Jun 7, 1999
Sold by
Kinney George R and Kinney George R
Bought by
Kinney George R
Create a Home Valuation Report for This Property
The Home Valuation Report is an in-depth analysis detailing your home's value as well as a comparison with similar homes in the area
Home Values in the Area
Average Home Value in this Area
Purchase History
| Date | Buyer | Sale Price | Title Company |
|---|---|---|---|
| Kinney Shane R | -- | First American | |
| Kinney Sharne R | -- | Hickman Land Title Co | |
| Kinney George R | -- | None Available | |
| Grk Roy Llc | -- | -- | |
| Kinney George R | -- | -- |
Source: Public Records
Mortgage History
| Date | Status | Borrower | Loan Amount |
|---|---|---|---|
| Open | Kinney Shane R | $173,000 |
Source: Public Records
Tax History
| Year | Tax Paid | Tax Assessment Tax Assessment Total Assessment is a certain percentage of the fair market value that is determined by local assessors to be the total taxable value of land and additions on the property. | Land | Improvement |
|---|---|---|---|---|
| 2025 | $2,215 | $343,950 | $100,000 | $243,950 |
| 2024 | $2,161 | $338,000 | $100,000 | $238,000 |
| 2023 | $2,582 | $415,000 | $74,000 | $341,000 |
| 2022 | $2,600 | $430,000 | $50,000 | $380,000 |
| 2021 | $2,004 | $297,000 | $50,000 | $247,000 |
| 2020 | $1,974 | $270,000 | $69,945 | $200,055 |
| 2019 | $1,834 | $235,000 | $39,986 | $195,014 |
| 2018 | $1,481 | $174,432 | $36,988 | $137,444 |
| 2017 | $1,329 | $145,003 | $37,005 | $107,998 |
| 2016 | $1,238 | $72,146 | $18,150 | $53,996 |
| 2015 | $1,177 | $70,199 | $18,150 | $52,049 |
| 2014 | $1,032 | $72,218 | $18,150 | $54,068 |
Source: Public Records
Map
Nearby Homes
- 4328 S 2175 W
- 2015 W 4225 S
- 4220 S 2075 W
- 4533 S 2075 W
- 2038 W 4600 S
- 4536 S 1900 W Unit 12
- 4642 S 1900 W Unit 41
- 4539 S 1800 W Unit 127
- 4061 S 2175 W
- 4602 Hathaway Dr
- 4269 S 2350 W
- 4047 S 2175 W
- 4248 S 2400 W
- 1959 3985 St S Unit 2
- 4593 Promenade Dr Unit 16
- 2153 W 4800 S
- 3923 S 1975 W Unit 15
- 4851 S 2075 W
- 1910 W 3920 S
- 2240 W 3875 S