Estimated Value: $420,859
About This Home
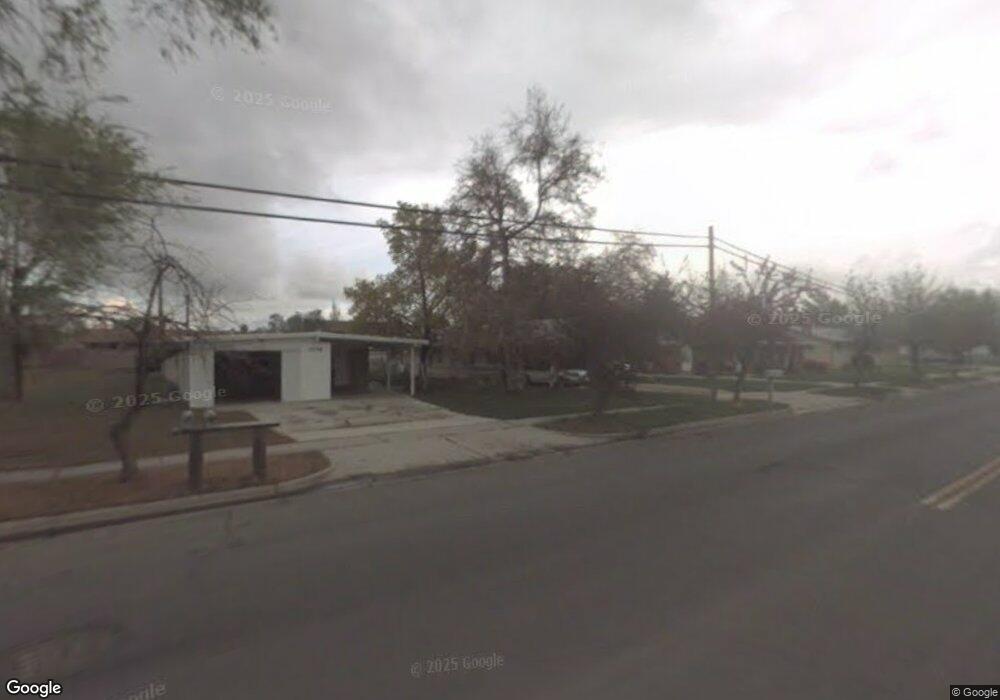
This home is located at 2024 W 4400 S, Roy, UT 84067 and is currently priced at $420,859, approximately $233 per square foot. 2024 W 4400 S is a home.
Ownership History
We collect this data history from publicly available records. To have your information removed, we recommend requesting removal directly through your county’s website.
Purchase Details
Home Financials for this Owner
Home Financials are based on the most recent Mortgage that was taken out on this home.Purchase Details
Purchase Details
Purchase Details
Purchase Details
Home Values in the Area
Average Home Value in this Area
Purchase History
We collect this data history from publicly available records. To have your information removed, we recommend requesting removal directly through your county’s website.
| Date | Buyer | Sale Price | Title Company |
|---|---|---|---|
| -- | First American | ||
| -- | Hickman Land Title Co | ||
| -- | None Available | ||
| -- | -- | ||
| -- | -- |
Mortgage History
We collect this data history from publicly available records. To have your information removed, we recommend requesting removal directly through your county’s website.
| Date | Status | Borrower | Loan Amount |
|---|---|---|---|
| Open | $173,000 | ||
| Closed | $169,400 |
Tax History
We collect this data history from publicly available records. To have your information removed, we recommend requesting removal directly through your county’s website.
| Year | Tax Paid | Tax Assessment Tax Assessment Total Assessment is a certain percentage of the fair market value that is determined by local assessors to be the total taxable value of land and additions on the property. | Land | Improvement |
|---|---|---|---|---|
| 2026 | $2,215 | $391,269 | $140,000 | $251,269 |
| 2025 | $2,215 | $343,950 | $100,000 | $243,950 |
| 2024 | $2,161 | $338,000 | $100,000 | $238,000 |
| 2023 | $2,582 | $415,000 | $74,000 | $341,000 |
| 2022 | $2,600 | $430,000 | $50,000 | $380,000 |
| 2021 | $2,004 | $297,000 | $50,000 | $247,000 |
| 2020 | $1,974 | $270,000 | $69,945 | $200,055 |
| 2019 | $1,834 | $235,000 | $39,986 | $195,014 |
| 2018 | $1,481 | $174,432 | $36,988 | $137,444 |
| 2017 | $1,329 | $145,003 | $37,005 | $107,998 |
| 2016 | $1,238 | $72,146 | $18,150 | $53,996 |
| 2015 | $1,177 | $70,199 | $18,150 | $52,049 |
| 2014 | $1,032 | $72,218 | $18,150 | $54,068 |
Map
- 2029 W 4400 S
- 1784 W 4500 S
- 4539 S 1800 W Unit 127
- 4302 S 2325 W
- 4103 S 2175 W
- 1766 W 4575 S
- 1962 W 4700 S
- 4061 S 2175 W
- 4602 Hathaway Dr
- 4251 S 2350 W
- 4598 S Blossom Glen Way
- 1959 3985 St S Unit 2
- 4068 S Lucy Ln Unit 12
- 4621 Wedgewood Dr
- 4082 S Sandridge Dr Unit 6
- 4046 Sandridge Dr Unit 3
- 4046 Sandridge Dr
- 3980 S 1950 W Unit 31
- 1606 Seneca Dr
- 3923 S 1975 W Unit 15
Ask me questions while you tour the home.