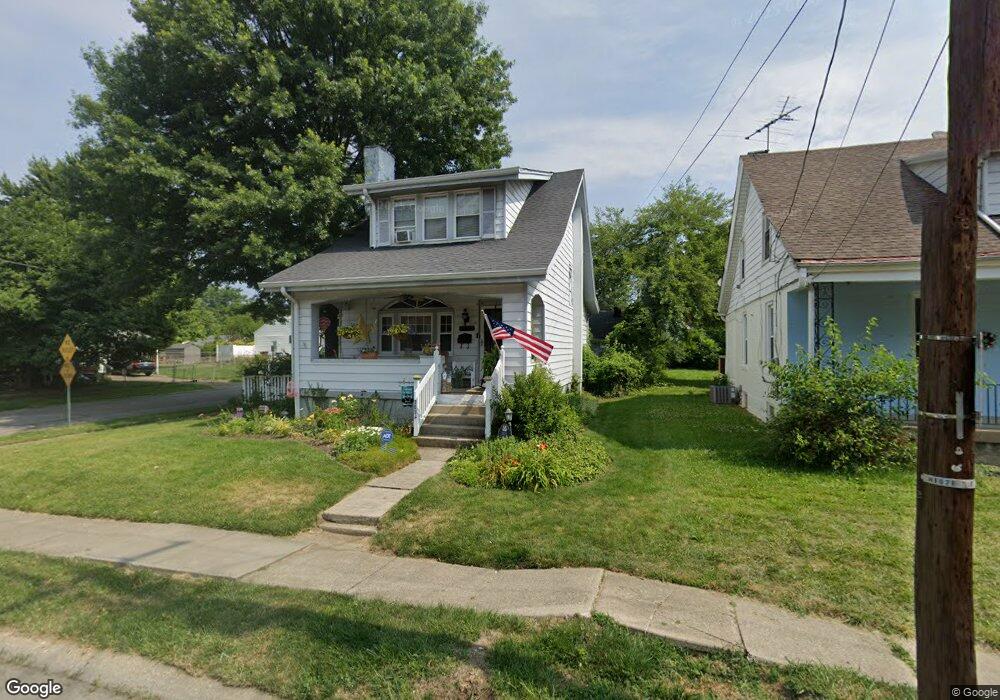
2024 W Galbraith Rd Cincinnati, OH 45239
Estimated Value: $176,000 - $200,000
3
Beds
2
Baths
1,345
Sq Ft
$138/Sq Ft
Est. Value
About This Home
This home is located at 2024 W Galbraith Rd, Cincinnati, OH 45239 and is currently estimated at $185,533, approximately $137 per square foot. 2024 W Galbraith Rd is a home located in Hamilton County with nearby schools including North College Hill Elementary School, North College Hill Middle School, and North College Hill High School.
Ownership History
Date
Name
Owned For
Owner Type
Purchase Details
Closed on
Nov 18, 2004
Sold by
Cendant Mobility Financial Corp
Bought by
Enderle Louis A and Enderle Norma J
Current Estimated Value
Home Financials for this Owner
Home Financials are based on the most recent Mortgage that was taken out on this home.
Original Mortgage
$78,000
Interest Rate
5.71%
Mortgage Type
Fannie Mae Freddie Mac
Purchase Details
Closed on
Aug 22, 2004
Sold by
Nelson Jodi A
Bought by
Cendant Mobility Financial Corp
Purchase Details
Closed on
Sep 2, 1994
Sold by
Lipps Robert John and Lipps Chunyueh
Bought by
Nelson Jodi A
Home Financials for this Owner
Home Financials are based on the most recent Mortgage that was taken out on this home.
Original Mortgage
$56,400
Interest Rate
8.65%
Create a Home Valuation Report for This Property
The Home Valuation Report is an in-depth analysis detailing your home's value as well as a comparison with similar homes in the area
Home Values in the Area
Average Home Value in this Area
Purchase History
| Date | Buyer | Sale Price | Title Company |
|---|---|---|---|
| Enderle Louis A | $97,500 | Vintage Title Agency Inc | |
| Cendant Mobility Financial Corp | $97,500 | Vintage Title Agency Inc | |
| Nelson Jodi A | -- | -- |
Source: Public Records
Mortgage History
| Date | Status | Borrower | Loan Amount |
|---|---|---|---|
| Closed | Enderle Louis A | $78,000 | |
| Previous Owner | Nelson Jodi A | $56,400 |
Source: Public Records
Tax History
| Year | Tax Paid | Tax Assessment Tax Assessment Total Assessment is a certain percentage of the fair market value that is determined by local assessors to be the total taxable value of land and additions on the property. | Land | Improvement |
|---|---|---|---|---|
| 2025 | $1,976 | $48,231 | $5,835 | $42,396 |
| 2024 | $1,935 | $48,231 | $5,835 | $42,396 |
| 2023 | $1,992 | $48,231 | $5,835 | $42,396 |
| 2022 | $1,040 | $23,325 | $4,778 | $18,547 |
| 2021 | $1,009 | $23,325 | $4,778 | $18,547 |
| 2020 | $895 | $23,325 | $4,778 | $18,547 |
| 2019 | $806 | $20,458 | $4,190 | $16,268 |
| 2018 | $807 | $20,458 | $4,190 | $16,268 |
| 2017 | $762 | $20,458 | $4,190 | $16,268 |
| 2016 | $747 | $21,200 | $6,048 | $15,152 |
| 2015 | $756 | $21,200 | $6,048 | $15,152 |
| 2014 | $1,301 | $21,200 | $6,048 | $15,152 |
| 2013 | $1,342 | $22,551 | $6,433 | $16,118 |
Source: Public Records
Map
Nearby Homes
- 6915 Lois Dr
- 2048 W Galbraith Rd
- 6942 Gloria Dr
- 6948 Mulberry St
- 1944 Dallas Ave
- 2027 Sundale Ave
- 6822 Betts Ave
- 6961 La Boiteaux Ave
- 6715 Betts Ave
- 1838 de Armand Ave
- 6623 Betts Ave
- 1814 Goodman Ave
- 1938 Waltham Ave
- 1913 Sterling Ave
- 2031 Emerson Ave
- 1826 Sterling Ave
- 6839 Greismer Ave
- 8724 Neptune Dr
- 1936 Cordova Ave
- 1811 Sterling Ave
- 2022 W Galbraith Rd
- 2028 W Galbraith Rd
- 2020 W Galbraith Rd
- 6908 Gloria Dr
- 2018 W Galbraith Rd
- 2030 W Galbraith Rd
- 6910 Gloria Dr
- 6907 Gloria Dr
- 2016 W Galbraith Rd
- 2021 W Galbraith Rd
- 6912 Gloria Dr
- 6909 Gloria Dr
- 2023 Galbraith Rd
- 6911 Gloria Dr
- 6914 Gloria Dr
- 6907 Lois Dr
- 2014 W Galbraith Rd
- 2017 W Galbraith Rd
- 2032 W Galbraith Rd
- 2019 W Galbraith Rd
Your Personal Tour Guide
Ask me questions while you tour the home.