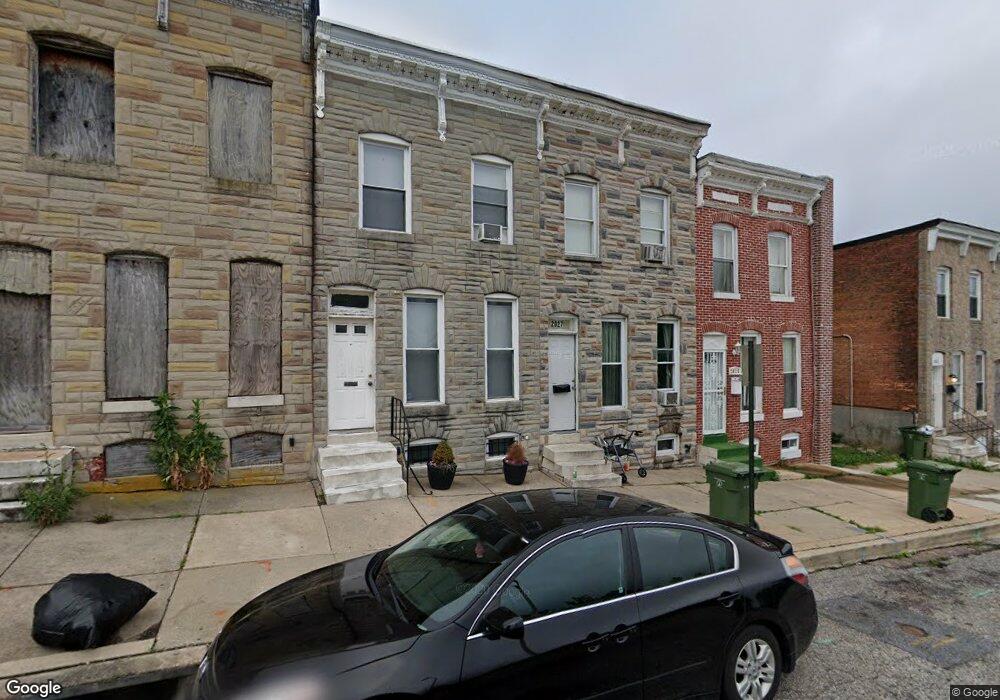
2025 E Oliver St Baltimore, MD 21213
Broadway East NeighborhoodEstimated Value: $205,000 - $224,403
Studio
1
Bath
616
Sq Ft
$349/Sq Ft
Est. Value
About This Home
This home is located at 2025 E Oliver St, Baltimore, MD 21213 and is currently estimated at $214,702, approximately $348 per square foot. 2025 E Oliver St is a home located in Baltimore City with nearby schools including Collington Square Elementary School, Booker T. Washington Middle School, and Paul Laurence Dunbar High School.
Ownership History
Date
Name
Owned For
Owner Type
Purchase Details
Closed on
Dec 12, 2024
Sold by
Cardinal Mgmt Llc
Bought by
Kesef Ventures Llc
Current Estimated Value
Home Financials for this Owner
Home Financials are based on the most recent Mortgage that was taken out on this home.
Original Mortgage
$164,250
Outstanding Balance
$162,963
Interest Rate
6.81%
Mortgage Type
New Conventional
Estimated Equity
$51,739
Purchase Details
Closed on
Mar 7, 2024
Sold by
Green Wallace B and Greene Wallace B
Bought by
Cardinal Mgmt Llc
Home Financials for this Owner
Home Financials are based on the most recent Mortgage that was taken out on this home.
Original Mortgage
$335,000
Interest Rate
7.17%
Mortgage Type
New Conventional
Purchase Details
Closed on
Aug 10, 2023
Sold by
Pollitzer Ellen G
Bought by
Greene Wallace B
Purchase Details
Closed on
Oct 21, 2002
Sold by
Redd Helen
Bought by
Greene Wallace B
Create a Home Valuation Report for This Property
The Home Valuation Report is an in-depth analysis detailing your home's value as well as a comparison with similar homes in the area
Home Values in the Area
Average Home Value in this Area
Purchase History
| Date | Buyer | Sale Price | Title Company |
|---|---|---|---|
| Kesef Ventures Llc | $219,000 | Fidelity National Title | |
| Kesef Ventures Llc | $219,000 | Fidelity National Title | |
| Cardinal Mgmt Llc | $62,500 | Old Republic National Title In | |
| Cardinal Mgmt Llc | $62,500 | Commerce Title | |
| Greene Wallace B | $1,400 | None Listed On Document | |
| Greene Wallace B | $1,400 | None Listed On Document | |
| Greene Wallace B | -- | -- |
Source: Public Records
Mortgage History
| Date | Status | Borrower | Loan Amount |
|---|---|---|---|
| Open | Kesef Ventures Llc | $164,250 | |
| Closed | Kesef Ventures Llc | $164,250 | |
| Previous Owner | Cardinal Mgmt Llc | $335,000 |
Source: Public Records
Tax History
| Year | Tax Paid | Tax Assessment Tax Assessment Total Assessment is a certain percentage of the fair market value that is determined by local assessors to be the total taxable value of land and additions on the property. | Land | Improvement |
|---|---|---|---|---|
| 2025 | $791 | $40,000 | $9,000 | $31,000 |
| 2024 | $791 | $33,667 | -- | -- |
| 2023 | $645 | $27,333 | $0 | $0 |
| 2022 | $496 | $21,000 | $4,000 | $17,000 |
| 2021 | $496 | $21,000 | $4,000 | $17,000 |
| 2020 | $496 | $21,000 | $4,000 | $17,000 |
| 2019 | $540 | $23,000 | $4,000 | $19,000 |
| 2018 | $543 | $23,000 | $4,000 | $19,000 |
| 2017 | $543 | $23,000 | $0 | $0 |
| 2016 | $284 | $25,000 | $0 | $0 |
| 2015 | $284 | $20,667 | $0 | $0 |
| 2014 | $284 | $16,333 | $0 | $0 |
Source: Public Records
Map
Nearby Homes
- 2108 E Hoffman St
- 2110 E Hoffman St
- 2118 E Hoffman St
- 1510 N Collington Ave
- 2007 E Hoffman St
- 2020 E Preston St
- 1513 N Wolfe St
- 1910 E Federal St
- 1908 E Federal St
- 1628 N Washington St
- 1518 N Wolfe St
- 1617 N Chapel St
- 1526 N Patterson Park Ave
- 1810 E Oliver St
- 1411 N Patterson Park Ave
- 1807 E Federal St
- 1908 E Lanvale St
- 2245 E Preston St
- 1748 N Chester St
- 1742 E Oliver St
- 2027 E Oliver St
- 2023 E Oliver St
- 2029 E Oliver St
- 2021 E Oliver St
- 2031 E Oliver St
- 2019 E Oliver St
- 2033 E Oliver St
- 2017 E Oliver St
- 2035 E Oliver St
- 2026 Llewelyn Ave
- 2015 E Oliver St
- 2028 Llewelyn Ave
- 2024 Llewelyn Ave
- 2022 Llewelyn Ave
- 2020 Llewelyn Ave
- 2013 E Oliver St
- 2030 Llewelyn Ave
- 2018 Llewelyn Ave
- 2016 Llewelyn Ave
- 2039 E Oliver St
Your Personal Tour Guide
Ask me questions while you tour the home.