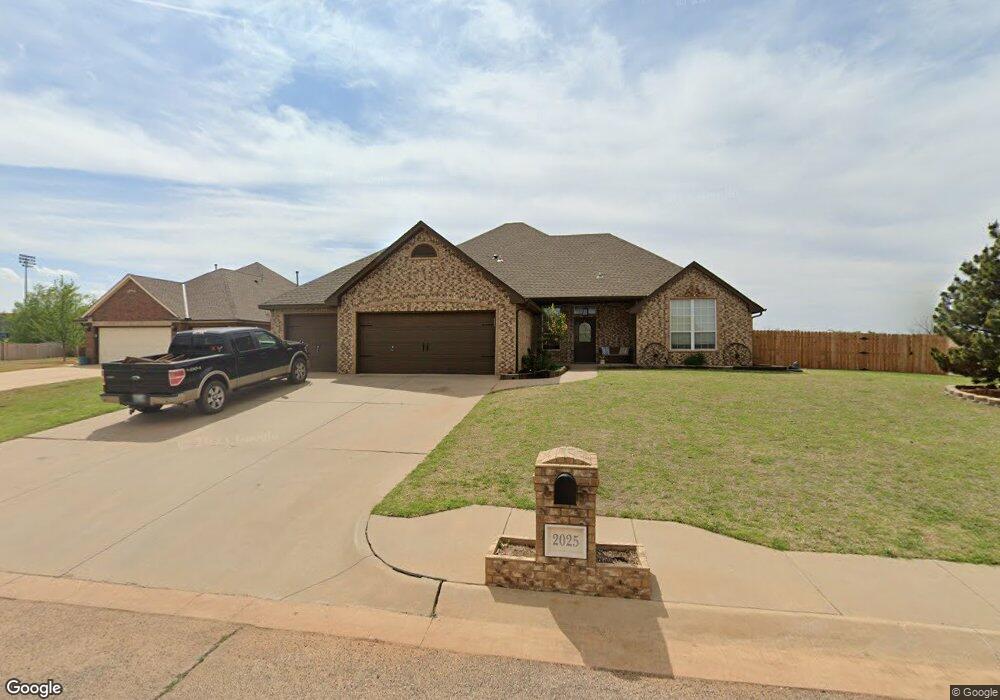
2025 Oak Cir Piedmont, OK 73078
Estimated Value: $311,000 - $386,000
3
Beds
2
Baths
2,082
Sq Ft
$162/Sq Ft
Est. Value
About This Home
This home is located at 2025 Oak Cir, Piedmont, OK 73078 and is currently estimated at $336,608, approximately $161 per square foot. 2025 Oak Cir is a home located in Canadian County with nearby schools including Piedmont Elementary School, Piedmont Middle School, and Piedmont Intermediate Elementary School.
Ownership History
Date
Name
Owned For
Owner Type
Purchase Details
Closed on
Aug 5, 2015
Sold by
Junction Properties Llc
Bought by
Trumbly Brian and Trumbly Cortney
Current Estimated Value
Home Financials for this Owner
Home Financials are based on the most recent Mortgage that was taken out on this home.
Original Mortgage
$188,510
Outstanding Balance
$148,714
Interest Rate
4.12%
Estimated Equity
$187,894
Purchase Details
Closed on
Apr 22, 2015
Sold by
Johnson Gregory C and Johnson Gina R
Bought by
Junction Properties Llc
Purchase Details
Closed on
Jun 12, 2003
Sold by
Callahan James Kent and Callahan Nancy
Home Financials for this Owner
Home Financials are based on the most recent Mortgage that was taken out on this home.
Original Mortgage
$164,000
Interest Rate
5.56%
Purchase Details
Closed on
Jan 24, 2002
Sold by
Windmill Park Llc
Create a Home Valuation Report for This Property
The Home Valuation Report is an in-depth analysis detailing your home's value as well as a comparison with similar homes in the area
Home Values in the Area
Average Home Value in this Area
Purchase History
| Date | Buyer | Sale Price | Title Company |
|---|---|---|---|
| Trumbly Brian | $190,000 | First American Title | |
| Junction Properties Llc | $149,000 | None Available | |
| -- | $21,500 | -- | |
| -- | $19,500 | -- |
Source: Public Records
Mortgage History
| Date | Status | Borrower | Loan Amount |
|---|---|---|---|
| Open | Trumbly Brian | $188,510 | |
| Previous Owner | -- | $164,000 |
Source: Public Records
Tax History Compared to Growth
Tax History
| Year | Tax Paid | Tax Assessment Tax Assessment Total Assessment is a certain percentage of the fair market value that is determined by local assessors to be the total taxable value of land and additions on the property. | Land | Improvement |
|---|---|---|---|---|
| 2024 | $3,258 | $32,189 | $5,041 | $27,148 |
| 2023 | $3,258 | $30,655 | $4,981 | $25,674 |
| 2022 | $3,133 | $29,196 | $4,884 | $24,312 |
| 2021 | $3,091 | $27,806 | $3,000 | $24,806 |
| 2020 | $3,005 | $26,571 | $3,000 | $23,571 |
| 2019 | $2,844 | $26,459 | $3,000 | $23,459 |
| 2018 | $2,744 | $25,200 | $3,000 | $22,200 |
| 2017 | $2,906 | $26,794 | $3,000 | $23,794 |
| 2016 | $2,726 | $26,045 | $3,000 | $23,045 |
| 2015 | $1,946 | $21,156 | $3,000 | $18,156 |
| 2014 | $1,946 | $20,539 | $3,000 | $17,539 |
Source: Public Records
Map
Nearby Homes
- 2005 Oak Cir
- 736 Cypress St NW
- 2267 Poplar Ave
- 777 Elm St
- 201 Cypress St NW
- 0 Way
- 0 NW 178th St Unit 1180705
- 194 Primrose Point Ave NE
- 1227 Stout Dr NW
- 410 Taylor Ave NW
- 1090 Auburn Cir
- 414 Harrison Ave NW
- 424 Spur Dr NW
- 601 Van Buren Ave NW
- OZARK Plan at Autumn Chase at Town Central
- CALI Plan at Autumn Chase at Town Central
- KINGSTON Plan at Autumn Chase at Town Central
- LAREDO Plan at Autumn Chase at Town Central
- ELGIN Plan at Autumn Chase at Town Central
- 1123 Van Buren Ave NW
- 2015 Oak Cir
- 750 Cypress St NW
- 2016 Oak Cir
- 787 Cypress St NW
- 773 Cypress St NW
- 2006 Oak Cir
- 759 Cypress St NW
- 759 Cypress St NW Unit NW
- 2015 Mimosa Dr NW
- 745 Cypress St NW
- 2005 Mimosa Dr NW
- 774 Windmill St
- 729 Cypress St NW
- 760 Windmill St
- 2197 Poplar Ave
- 746 Windmill St
- 2006 Mimosa Dr NW
- 2016 Mimosa Dr NW
- 711 Cypress St NW
- 730 Windmill St