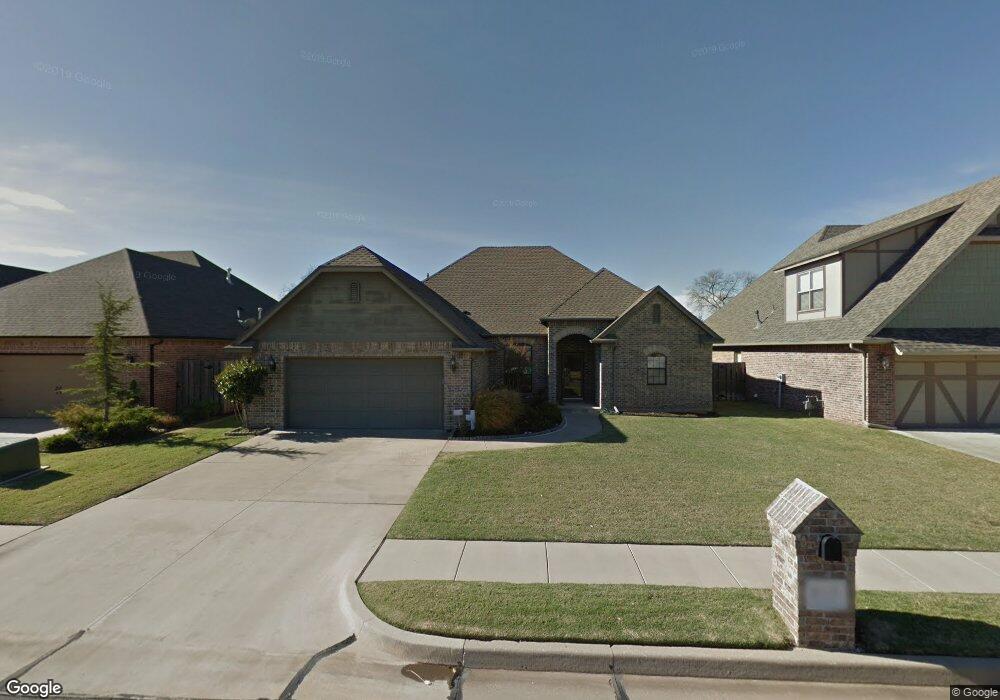
2025 Pony Express Trail Edmond, OK 73003
Thomas Trails NeighborhoodEstimated Value: $290,905 - $316,000
3
Beds
2
Baths
1,738
Sq Ft
$173/Sq Ft
Est. Value
About This Home
This home is located at 2025 Pony Express Trail, Edmond, OK 73003 and is currently estimated at $299,976, approximately $172 per square foot. 2025 Pony Express Trail is a home located in Oklahoma County with nearby schools including John Ross Elementary School, Cheyenne Middle School, and North High School.
Ownership History
Date
Name
Owned For
Owner Type
Purchase Details
Closed on
Dec 22, 2012
Sold by
Justis Pauul Tanner
Bought by
Leajustic Amber
Current Estimated Value
Purchase Details
Closed on
Apr 30, 2008
Sold by
Carder Custom Homes Inc
Bought by
Justis Paul Tanner and Justis Amber Lea
Home Financials for this Owner
Home Financials are based on the most recent Mortgage that was taken out on this home.
Original Mortgage
$169,149
Interest Rate
5.89%
Mortgage Type
FHA
Purchase Details
Closed on
Oct 29, 2007
Sold by
Garrett Development Inc
Bought by
Carder Custom Homes Inc
Home Financials for this Owner
Home Financials are based on the most recent Mortgage that was taken out on this home.
Original Mortgage
$142,400
Interest Rate
6.37%
Mortgage Type
Purchase Money Mortgage
Create a Home Valuation Report for This Property
The Home Valuation Report is an in-depth analysis detailing your home's value as well as a comparison with similar homes in the area
Home Values in the Area
Average Home Value in this Area
Purchase History
| Date | Buyer | Sale Price | Title Company |
|---|---|---|---|
| Leajustic Amber | -- | None Available | |
| Justis Paul Tanner | $172,000 | Lawyers Title Of Ok City Inc | |
| Carder Custom Homes Inc | $32,000 | Lawyers Title Of Ok City Inc |
Source: Public Records
Mortgage History
| Date | Status | Borrower | Loan Amount |
|---|---|---|---|
| Previous Owner | Justis Paul Tanner | $169,149 | |
| Previous Owner | Carder Custom Homes Inc | $142,400 |
Source: Public Records
Tax History Compared to Growth
Tax History
| Year | Tax Paid | Tax Assessment Tax Assessment Total Assessment is a certain percentage of the fair market value that is determined by local assessors to be the total taxable value of land and additions on the property. | Land | Improvement |
|---|---|---|---|---|
| 2024 | $2,421 | $24,954 | $3,974 | $20,980 |
| 2023 | $2,421 | $24,228 | $3,964 | $20,264 |
| 2022 | $2,357 | $23,522 | $4,468 | $19,054 |
| 2021 | $2,274 | $22,837 | $4,650 | $18,187 |
| 2020 | $2,232 | $22,172 | $4,249 | $17,923 |
| 2019 | $2,174 | $21,527 | $4,272 | $17,255 |
| 2018 | $2,120 | $20,900 | $0 | $0 |
| 2017 | $2,246 | $21,174 | $4,279 | $16,895 |
| 2016 | $2,224 | $21,009 | $4,042 | $16,967 |
| 2015 | $2,181 | $20,630 | $4,042 | $16,588 |
| 2014 | $2,116 | $20,043 | $4,042 | $16,001 |
Source: Public Records
Map
Nearby Homes
- 422 Oregon Trail
- 1804 Saint Christopher Dr
- 2026 Appalachian Trail
- 405 Bright Angel Trail
- 326 Bozeman Trail
- 308 Clermont Dr
- 325 Cherryvale Rd
- 2101 N Kelly Ave
- 1713 Timber Ridge Rd
- 1617 Apian Way
- 2802 Coldbrook Ln
- 1225 Sequoyah Place Unit D
- 249 Cobblestone Cir
- 1217 Sequoyah Place Unit C
- 1224 Capitol Dr
- 1212 Sequoyah Place Unit C
- 404 Timber Ridge Rd
- 503 Hunters Ct
- 2901 Stonebrook Rd
- 2824 Stonebrook Rd
- 2017 Pony Express Trail
- 2103 Pony Express Trail
- 2009 Pony Express Trail
- 2111 Pony Express Trail
- 2024 Pony Express Trail
- 2016 Pony Express Trail
- 2102 Pony Express Trail
- 2001 Pony Express Trail
- 2008 Pony Express Trail
- 2110 Pony Express Trail
- 458 Donner Trail
- 461 Gold Fields Trail
- 450 Donner Trail
- 2109 Goodnight Trail
- 442 Donner Trail
- 453 Gold Fields Trail
- 445 Gold Fields Trail
- 426 Donner Trail
- 462 Oregon Trail
- 2032 Goodnight Trail