Estimated Value: $200,699 - $231,000
--
Bed
1
Bath
1,218
Sq Ft
$172/Sq Ft
Est. Value
About This Home
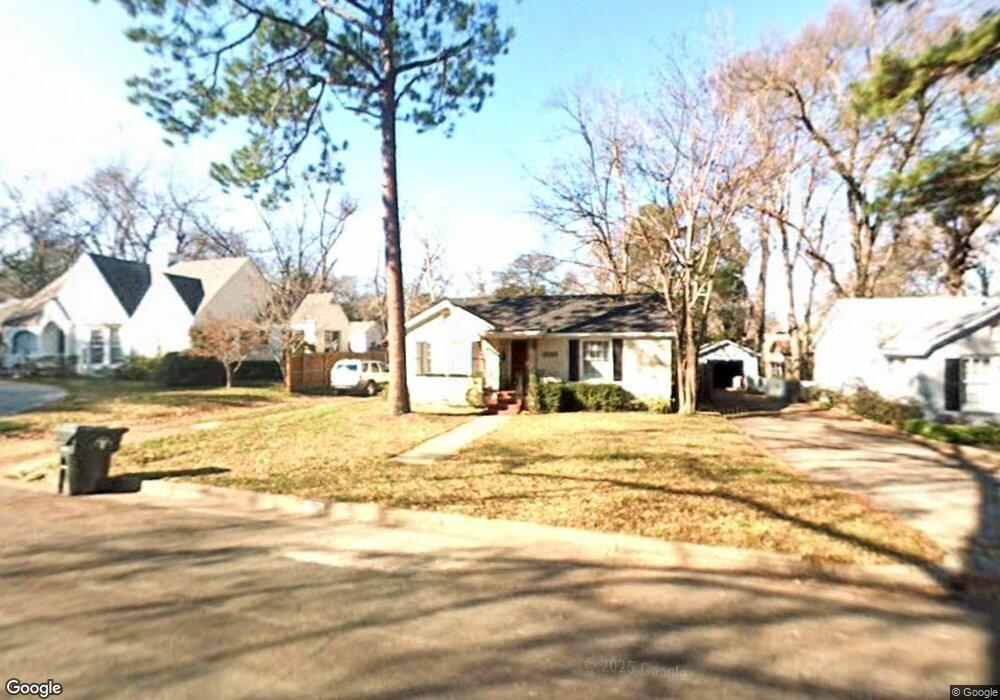
This home is located at 2025 S Sneed Ave, Tyler, TX 75701 and is currently estimated at $209,425, approximately $171 per square foot. 2025 S Sneed Ave is a home located in Smith County with nearby schools including Woods Elementary School, Hogg Middle School, and Tyler Legacy High School.
Ownership History
Date
Name
Owned For
Owner Type
Purchase Details
Closed on
Aug 6, 2018
Sold by
Linn Estate Holdings Ltd
Bought by
Greinert Kristal L
Current Estimated Value
Home Financials for this Owner
Home Financials are based on the most recent Mortgage that was taken out on this home.
Original Mortgage
$100,000
Outstanding Balance
$86,483
Interest Rate
4.5%
Mortgage Type
Purchase Money Mortgage
Estimated Equity
$122,942
Purchase Details
Closed on
May 25, 2007
Sold by
Magnolia Investments
Bought by
Creath Deborah L and Creath Robert
Home Financials for this Owner
Home Financials are based on the most recent Mortgage that was taken out on this home.
Original Mortgage
$78,900
Interest Rate
7.5%
Mortgage Type
Purchase Money Mortgage
Create a Home Valuation Report for This Property
The Home Valuation Report is an in-depth analysis detailing your home's value as well as a comparison with similar homes in the area
Home Values in the Area
Average Home Value in this Area
Purchase History
| Date | Buyer | Sale Price | Title Company |
|---|---|---|---|
| Greinert Kristal L | -- | None Available | |
| Creath Deborah L | -- | Smith County Title Company | |
| Creath Deborah L | -- | Smith County Title Company |
Source: Public Records
Mortgage History
| Date | Status | Borrower | Loan Amount |
|---|---|---|---|
| Open | Greinert Kristal L | $100,000 | |
| Previous Owner | Creath Deborah L | $78,900 |
Source: Public Records
Tax History Compared to Growth
Tax History
| Year | Tax Paid | Tax Assessment Tax Assessment Total Assessment is a certain percentage of the fair market value that is determined by local assessors to be the total taxable value of land and additions on the property. | Land | Improvement |
|---|---|---|---|---|
| 2025 | $1,911 | $215,628 | $67,295 | $148,333 |
| 2024 | $1,911 | $168,265 | $23,818 | $150,272 |
| 2023 | $2,667 | $155,133 | $23,818 | $131,315 |
| 2022 | $2,724 | $139,062 | $20,415 | $118,647 |
| 2021 | $2,659 | $126,748 | $20,415 | $106,333 |
| 2020 | $2,545 | $120,906 | $20,415 | $100,491 |
| 2019 | $2,364 | $108,110 | $13,610 | $94,500 |
| 2018 | $1,710 | $78,610 | $13,610 | $65,000 |
| 2017 | $1,678 | $78,610 | $13,610 | $65,000 |
| 2016 | $1,980 | $92,726 | $13,610 | $79,116 |
| 2015 | $1,834 | $89,128 | $13,610 | $75,518 |
| 2014 | $1,834 | $86,326 | $13,610 | $72,716 |
Source: Public Records
Map
Nearby Homes
- 2026 S Wall Ave
- 2108 S Wall Ave
- 2110 Belmont Dr
- 1931 S Wiley Ave
- 2319 Pollard Dr
- 2215 Homestead Ln
- 2315 Homestead Ln
- 2210 Homestead Ln
- 2521 Pounds Ave
- 1102 S Peach Ave S
- 515 & 517 Charnwood St
- 3922 & 3928 McDonald Rd
- 2313 Dietz Ln
- 2431 Homestead Ln
- 2413 Dietz Ln
- 2425 Dietz Ln
- 2322 Dietz Ln
- 2410 Dietz Ln
- 1300 Sunset Dr
- 2438 Dietz Ln
- 2025 2025 S Sneed
- 2021 S Sneed Ave
- 2021 2021 S Sneed
- 2021 2021 South Sneed
- 2103 S Sneed Ave
- 519 E 8th St
- 2015 S Sneed Ave
- 2109 S Sneed Ave
- 2109 2109 S Sneed
- 2024 2024 S Sneed Ave
- 509 E 8th St
- 509 509 E 8th
- 2024 S Sneed Ave
- 2106 S Sneed Ave
- 2115 S Sneed Ave
- 2016 S Sneed Ave
- 2100 S Sneed Ave
- 2034 S Wall Ave
- 2007 S Sneed Ave
- 2007 2007 S Sneed