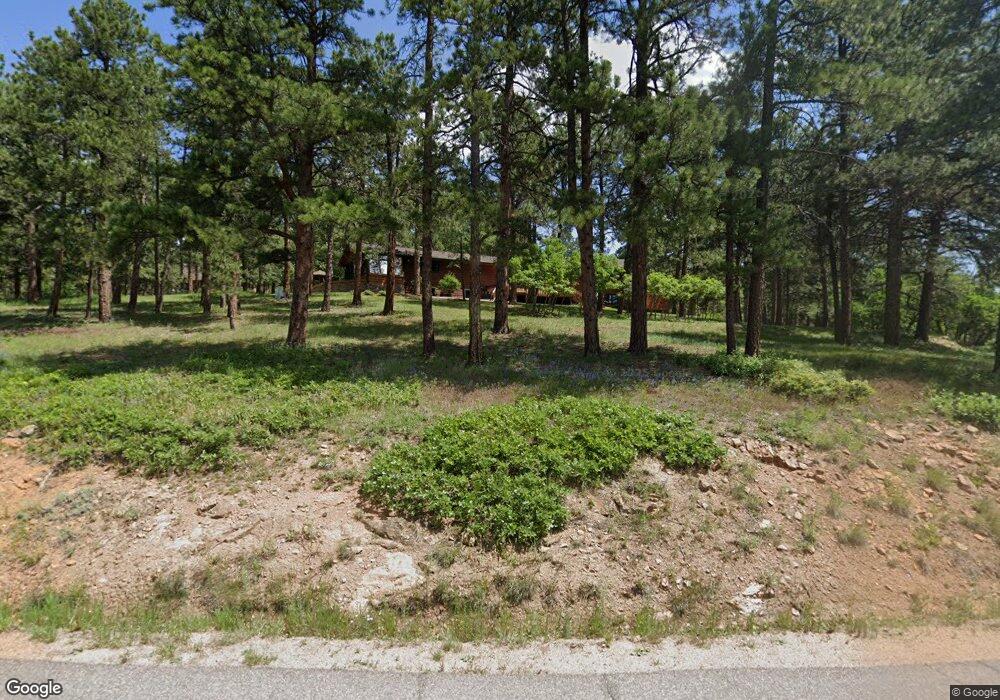
20255 Flint Ln Morrison, CO 80465
Homestead NeighborhoodEstimated Value: $1,135,000 - $1,209,000
4
Beds
3
Baths
4,016
Sq Ft
$294/Sq Ft
Est. Value
About This Home
This home is located at 20255 Flint Ln, Morrison, CO 80465 and is currently estimated at $1,179,532, approximately $293 per square foot. 20255 Flint Ln is a home located in Jefferson County with nearby schools including West Jefferson Elementary School, West Jefferson Middle School, and Conifer Senior High School.
Ownership History
Date
Name
Owned For
Owner Type
Purchase Details
Closed on
Sep 28, 2021
Sold by
Sweeney Patrick A and Sweeney Sally E
Bought by
Correll Dana B and Correll Matthew B
Current Estimated Value
Home Financials for this Owner
Home Financials are based on the most recent Mortgage that was taken out on this home.
Original Mortgage
$500,000
Outstanding Balance
$422,776
Interest Rate
2.8%
Mortgage Type
New Conventional
Estimated Equity
$756,756
Purchase Details
Closed on
Jun 17, 1996
Sold by
Garfias David F and Garfias Elizabeth Joyce
Bought by
Sweeney Patrick A and Sweeney Sally E
Home Financials for this Owner
Home Financials are based on the most recent Mortgage that was taken out on this home.
Original Mortgage
$159,000
Interest Rate
8.24%
Mortgage Type
Balloon
Create a Home Valuation Report for This Property
The Home Valuation Report is an in-depth analysis detailing your home's value as well as a comparison with similar homes in the area
Home Values in the Area
Average Home Value in this Area
Purchase History
| Date | Buyer | Sale Price | Title Company |
|---|---|---|---|
| Correll Dana B | $1,055,000 | Fidelity National Title | |
| Sweeney Patrick A | $316,500 | -- |
Source: Public Records
Mortgage History
| Date | Status | Borrower | Loan Amount |
|---|---|---|---|
| Open | Correll Dana B | $500,000 | |
| Previous Owner | Sweeney Patrick A | $159,000 |
Source: Public Records
Tax History
| Year | Tax Paid | Tax Assessment Tax Assessment Total Assessment is a certain percentage of the fair market value that is determined by local assessors to be the total taxable value of land and additions on the property. | Land | Improvement |
|---|---|---|---|---|
| 2024 | $6,539 | $73,806 | $21,413 | $52,393 |
| 2023 | $6,539 | $73,806 | $21,413 | $52,393 |
| 2022 | $4,816 | $53,585 | $13,284 | $40,301 |
| 2021 | $4,225 | $55,126 | $13,666 | $41,460 |
| 2020 | $3,746 | $49,796 | $11,474 | $38,322 |
| 2019 | $3,691 | $49,796 | $11,474 | $38,322 |
| 2018 | $3,733 | $48,888 | $10,691 | $38,197 |
| 2017 | $3,275 | $48,888 | $10,691 | $38,197 |
| 2016 | $2,997 | $43,574 | $10,440 | $33,134 |
| 2015 | $2,886 | $50,113 | $10,440 | $39,673 |
| 2014 | $2,886 | $40,093 | $9,097 | $30,996 |
Source: Public Records
Map
Nearby Homes
- 8550 S Mariposa Dr
- 8220 Iowa Gulch Rd
- 8752 S Ault Ln
- 8045 S Wagon Wheel Rd
- Lot 1 Iowa Gulch Rd
- 8066 Federation Dr
- 8722 S Ault Ln
- 8171 S Homesteader Dr
- 8111 S Homesteader Dr
- 8001 S Homesteader Dr
- 7871 Gold Rush Place Unit 3
- 7837 S Settlers Dr
- 7552 Surrey Dr
- 7790 S Homesteader Dr
- 9146 Broken Bow Ranch Rd
- 7559 S Turkey Creek Rd
- 7489 S Turkey Creek Rd
- 18844 Ute Vista Trail
- 7438 S Turkey Creek Rd
- 8529 S Deer Creek Canyon Rd
- 8383 S Mica Way
- 20345 Flint Ln
- 20346 Flint Ln
- 20266 Flint Ln
- 8343 S Mica Way
- 20385 Flint Ln
- 20456 Flint Ln
- 8403 Quartz Trail
- 8422 S Mica Way
- 8382 S Mica Way
- 8424 Quartz Trail
- 8342 S Mica Way
- 8264 S Wagon Wheel Rd
- 20095 Flint Ln
- 8413 Quartz Trail
- 19976 Flint Ln
- 20526 Flint Ln
- 8480 S Mariposa Dr
- 8433 Quartz Trail
- 20156 Flint Ln
Your Personal Tour Guide
Ask me questions while you tour the home.