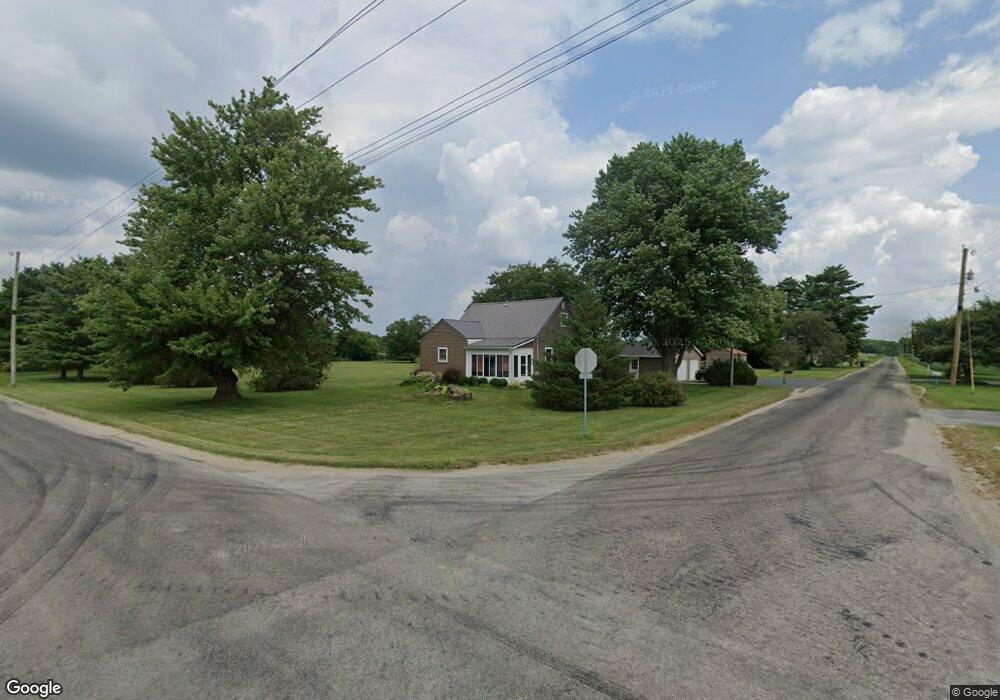
2026 E 100 S Huntington, IN 46750
Estimated Value: $200,000 - $268,000
2
Beds
1
Bath
1,688
Sq Ft
$134/Sq Ft
Est. Value
About This Home
This home is located at 2026 E 100 S, Huntington, IN 46750 and is currently estimated at $226,509, approximately $134 per square foot. 2026 E 100 S is a home located in Huntington County with nearby schools including Lancaster Elementary School and Huntington North High School.
Ownership History
Date
Name
Owned For
Owner Type
Purchase Details
Closed on
Aug 19, 2024
Sold by
Broom Michael J and Broom Laura
Bought by
Hart Chloe and Teusch Preston
Current Estimated Value
Home Financials for this Owner
Home Financials are based on the most recent Mortgage that was taken out on this home.
Original Mortgage
$145,000
Outstanding Balance
$143,365
Interest Rate
6.89%
Mortgage Type
New Conventional
Estimated Equity
$83,144
Create a Home Valuation Report for This Property
The Home Valuation Report is an in-depth analysis detailing your home's value as well as a comparison with similar homes in the area
Home Values in the Area
Average Home Value in this Area
Purchase History
| Date | Buyer | Sale Price | Title Company |
|---|---|---|---|
| Hart Chloe | $185,000 | None Listed On Document |
Source: Public Records
Mortgage History
| Date | Status | Borrower | Loan Amount |
|---|---|---|---|
| Open | Hart Chloe | $145,000 |
Source: Public Records
Tax History Compared to Growth
Tax History
| Year | Tax Paid | Tax Assessment Tax Assessment Total Assessment is a certain percentage of the fair market value that is determined by local assessors to be the total taxable value of land and additions on the property. | Land | Improvement |
|---|---|---|---|---|
| 2024 | $1,364 | $192,800 | $29,300 | $163,500 |
| 2023 | $1,168 | $168,100 | $29,300 | $138,800 |
| 2022 | $1,082 | $155,900 | $29,300 | $126,600 |
| 2021 | $941 | $127,600 | $29,300 | $98,300 |
| 2020 | $847 | $116,100 | $29,300 | $86,800 |
| 2019 | $731 | $112,900 | $29,300 | $83,600 |
| 2018 | $731 | $112,900 | $29,300 | $83,600 |
| 2017 | $649 | $112,800 | $29,300 | $83,500 |
| 2016 | $540 | $108,400 | $29,300 | $79,100 |
| 2014 | $524 | $104,600 | $29,300 | $75,300 |
| 2013 | $524 | $99,900 | $29,300 | $70,600 |
Source: Public Records
Map
Nearby Homes
- 2090 S Warren Rd
- 798 N 500 E
- 3659 S Warren Rd
- 2454 S 300 E
- 156 W Markle Rd
- 4091 S Warren Rd
- 1656 W 300 S
- 1264 Stintson Dr Unit 2
- 1251 Stintson Dr
- 310 Cottonwood Ct
- 451 Cottonwood Ct
- 515 E Riverside Rd
- 8 Turquoise St
- 1535 Henry St
- 8 Topaz Dr
- 18 Shamrock Ct
- 1421 Charles St
- 553 S Briant St
- 2035 Willow Bend
- 637 Mayne St