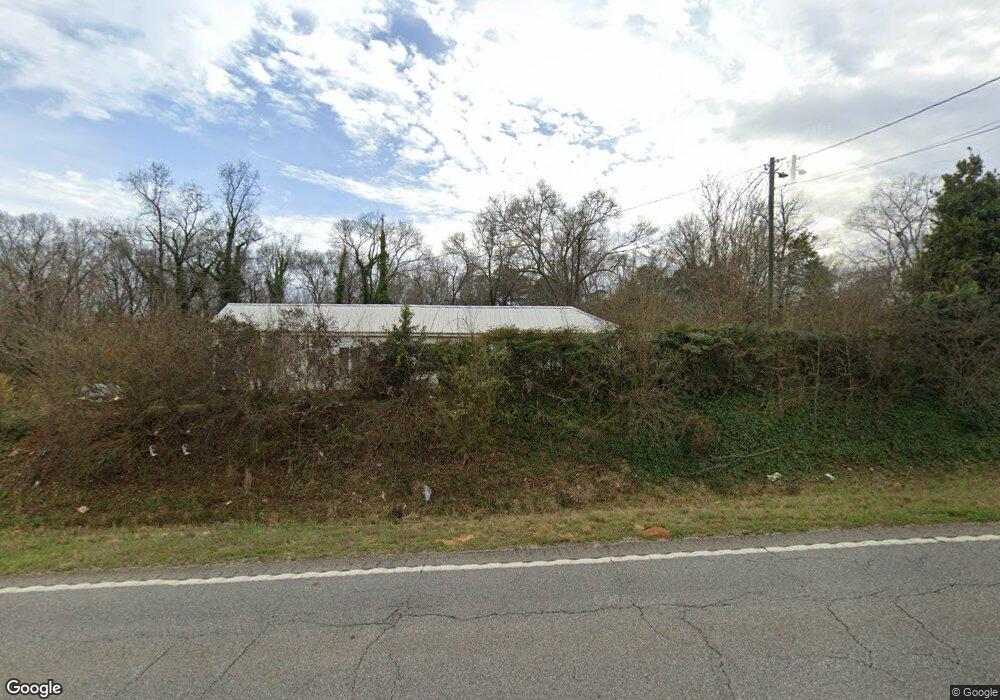
2026 Us Highway 82 Georgetown, GA 39854
Estimated Value: $61,932 - $111,000
3
Beds
2
Baths
1,092
Sq Ft
$78/Sq Ft
Est. Value
About This Home
This home is located at 2026 Us Highway 82, Georgetown, GA 39854 and is currently estimated at $84,644, approximately $77 per square foot. 2026 Us Highway 82 is a home located in Quitman County with nearby schools including Quitman County Elementary School and Quitman County High School.
Ownership History
Date
Name
Owned For
Owner Type
Purchase Details
Closed on
Apr 8, 2019
Sold by
Wilson Justin
Bought by
Wynn Kimberly
Current Estimated Value
Purchase Details
Closed on
Jan 12, 2011
Sold by
Wilson Johnny C
Bought by
Wilson Justin
Purchase Details
Closed on
Aug 21, 2008
Sold by
Peacock Martha S
Bought by
Wilson Johnny C
Home Financials for this Owner
Home Financials are based on the most recent Mortgage that was taken out on this home.
Original Mortgage
$56,620
Interest Rate
6.61%
Mortgage Type
New Conventional
Purchase Details
Closed on
Jan 1, 2006
Sold by
Peacock Martha S
Bought by
Peacock Martha S
Purchase Details
Closed on
Feb 26, 1998
Sold by
Peacock Jack
Bought by
Peacock Martha S
Purchase Details
Closed on
Oct 20, 1959
Sold by
Mcdaniel Mary F
Bought by
Peacock Jack
Purchase Details
Closed on
Nov 23, 1945
Sold by
Atherton Walter Raymond
Bought by
Mcdaniel Mary F
Create a Home Valuation Report for This Property
The Home Valuation Report is an in-depth analysis detailing your home's value as well as a comparison with similar homes in the area
Home Values in the Area
Average Home Value in this Area
Purchase History
| Date | Buyer | Sale Price | Title Company |
|---|---|---|---|
| Wynn Kimberly | $1,500 | -- | |
| Wilson Justin | $16,087 | -- | |
| Wilson Johnny C | -- | -- | |
| Peacock Martha S | $11,300 | -- | |
| Peacock Martha S | -- | -- | |
| Peacock Jack | -- | -- | |
| Mcdaniel Mary F | -- | -- |
Source: Public Records
Mortgage History
| Date | Status | Borrower | Loan Amount |
|---|---|---|---|
| Previous Owner | Wilson Johnny C | $56,620 |
Source: Public Records
Tax History Compared to Growth
Tax History
| Year | Tax Paid | Tax Assessment Tax Assessment Total Assessment is a certain percentage of the fair market value that is determined by local assessors to be the total taxable value of land and additions on the property. | Land | Improvement |
|---|---|---|---|---|
| 2025 | $703 | $15,424 | $2,600 | $12,824 |
| 2024 | $703 | $15,424 | $2,600 | $12,824 |
| 2023 | $709 | $15,424 | $2,600 | $12,824 |
| 2022 | $638 | $15,424 | $2,600 | $12,824 |
| 2021 | $468 | $12,428 | $3,596 | $8,832 |
| 2020 | $468 | $12,428 | $3,596 | $8,832 |
| 2019 | $468 | $12,428 | $3,596 | $8,832 |
| 2018 | $398 | $12,428 | $3,596 | $8,832 |
| 2017 | $398 | $12,948 | $3,596 | $9,352 |
| 2016 | $414 | $12,948 | $3,596 | $9,352 |
| 2015 | -- | $12,948 | $3,596 | $9,352 |
| 2014 | -- | $12,948 | $3,596 | $9,352 |
| 2013 | -- | $12,948 | $3,596 | $9,351 |
Source: Public Records
Map
Nearby Homes
- 0 Lots 2 3 4 Point Dr Unit 20065
- 0 Tanglewood Trail Unit 27290
- 15 Bay Ln
- 2036 Georgia 39
- 1794 Georgia 50
- 48 Ralph Sr Rd
- 0 Old 39 Rd Unit 15.69
- 15.69 Old 39 Rd
- 0 Lower Lumpkin Rd
- 0 Lower Lumpkin Rd Unit 10511110
- 10 Whip o Will Ln
- 102-103 Magnolia Dr
- 111 Arrowhead Dr
- 76 Jacqueline Dr
- 0 Jacqueline Dr
- 253 Kaigler Rd
- 98 Cool Branch Rd
- 000 Cool Branch Rd
- 0 Cool Branch Rd
- 1 Cool Branch Rd
- 2016 Us Highway 82
- 1985 Us Highway 82
- 1986 Us Highway 82
- 1953 Us Highway 82
- 25 Point Dr Unit Lot 12
- 0 Rosalyn Rd Unit Lot 12 8433309
- 0 Tanglewood Trail Unit Lot 20 8433300
- 16 Rosalyn Rd
- Lot 20 Tanglewood Trail
- 0 Tanglewood Trail Unit LOT 22 20171679
- 321 Pataula Heights Ln
- 0 Tanglewood Trail Unit 16274
- 0 Tanglewood Trail Unit 16273
- 0 Tanglewood Trail Unit 16272
- 0 Tanglewood Trail Unit 16586
- 0 Tanglewood Trail Unit 16585
- 0 Tanglewood Trail Unit 16590
- 0 Tanglewood Trail Unit 16671
- 0 Tanglewood Trail Unit 16916
- 0 Tanglewood Trail Unit 17410