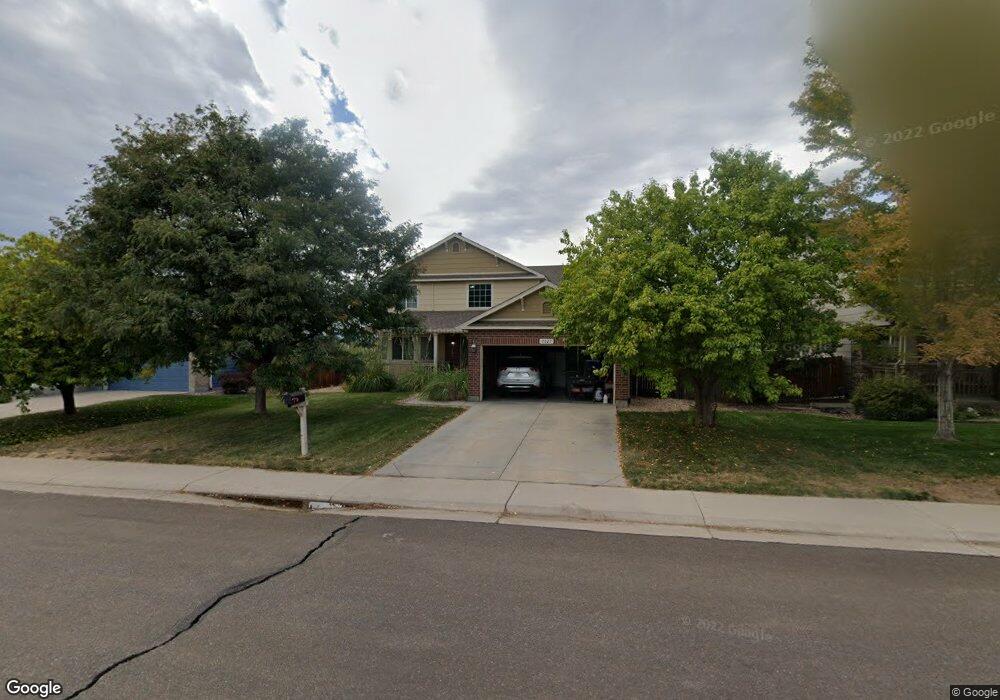
2027 E 148th Ave Thornton, CO 80602
Quail Valley NeighborhoodEstimated Value: $566,685 - $624,000
3
Beds
3
Baths
2,585
Sq Ft
$230/Sq Ft
Est. Value
About This Home
This home is located at 2027 E 148th Ave, Thornton, CO 80602 and is currently estimated at $594,671, approximately $230 per square foot. 2027 E 148th Ave is a home located in Adams County with nearby schools including Silver Creek Elementary School, Rocky Top Middle School, and Mountain Range High School.
Ownership History
Date
Name
Owned For
Owner Type
Purchase Details
Closed on
May 9, 2023
Sold by
Chung Chang Loong and Weng Miao Feng
Bought by
Chang Loong Chung Trust and Miao Feng Weng Trust
Current Estimated Value
Purchase Details
Closed on
Jan 3, 2022
Sold by
Cwam1 Llc
Bought by
Chung Chang Loong and Weng Miao Feng
Home Financials for this Owner
Home Financials are based on the most recent Mortgage that was taken out on this home.
Original Mortgage
$395,500
Interest Rate
2.34%
Mortgage Type
New Conventional
Purchase Details
Closed on
Feb 8, 2017
Sold by
Chung Chang Loong
Bought by
Cwami Llc
Purchase Details
Closed on
Oct 15, 2004
Sold by
Melody Homes Inc
Bought by
Chung Chang Loong
Home Financials for this Owner
Home Financials are based on the most recent Mortgage that was taken out on this home.
Original Mortgage
$200,600
Interest Rate
5.82%
Mortgage Type
Unknown
Create a Home Valuation Report for This Property
The Home Valuation Report is an in-depth analysis detailing your home's value as well as a comparison with similar homes in the area
Home Values in the Area
Average Home Value in this Area
Purchase History
| Date | Buyer | Sale Price | Title Company |
|---|---|---|---|
| Chang Loong Chung Trust | -- | None Listed On Document | |
| Chung Chang Loong | -- | Land Title Guarantee Co | |
| Cwami Llc | -- | None Available | |
| Chung Chang Loong | $250,755 | Land Title |
Source: Public Records
Mortgage History
| Date | Status | Borrower | Loan Amount |
|---|---|---|---|
| Previous Owner | Chung Chang Loong | $395,500 | |
| Previous Owner | Chung Chang Loong | $200,600 |
Source: Public Records
Tax History Compared to Growth
Tax History
| Year | Tax Paid | Tax Assessment Tax Assessment Total Assessment is a certain percentage of the fair market value that is determined by local assessors to be the total taxable value of land and additions on the property. | Land | Improvement |
|---|---|---|---|---|
| 2024 | $3,670 | $34,940 | $8,000 | $26,940 |
| 2023 | $3,632 | $39,170 | $7,510 | $31,660 |
| 2022 | $3,218 | $28,260 | $7,710 | $20,550 |
| 2021 | $3,218 | $28,260 | $7,710 | $20,550 |
| 2020 | $3,209 | $28,760 | $7,720 | $21,040 |
| 2019 | $3,215 | $28,760 | $7,720 | $21,040 |
| 2018 | $3,083 | $26,790 | $7,560 | $19,230 |
| 2017 | $2,803 | $26,790 | $7,560 | $19,230 |
| 2016 | $2,260 | $21,030 | $4,540 | $16,490 |
| 2015 | $2,257 | $21,030 | $4,540 | $16,490 |
| 2014 | $2,190 | $19,840 | $3,980 | $15,860 |
Source: Public Records
Map
Nearby Homes
- 14703 High St
- 14685 Williams St
- 14642 Williams St
- 14625 Vine St
- 14558 Vine St
- 1920 E 145th Ave
- 2028 E 145th Ave
- 14962 Williams St
- 1936 E 144th Dr
- 14953 Columbine St
- 14511 Detroit Way
- 15021 Josephine St
- 15171 Gaylord St
- 2607 E 142nd Ave
- Graham Plan at Eastcreek Farm - The Camden Collection
- Lucent II Plan at Eastcreek Farm - Paired Homes
- Oliver Plan at Eastcreek Farm - The Camden Collection
- Lucent I Plan at Eastcreek Farm - Paired Homes
- Hartford Plan at Eastcreek Farm - The Camden Collection
- Vibrant II Plan at Eastcreek Farm - Paired Homes
- 2039 E 148th Ave
- 2003 E 148th Ave
- 2032 E 148th Ave
- 14788 High St
- 2044 E 148th Ave
- 14767 High St
- 14772 High St
- 14783 Race St
- 14810 Williams St
- 14851 Vine St
- 14751 High St
- 14763 Race St
- 14754 Williams St
- 14756 High St
- 2056 E 148th Ave
- 2000 E 148th Place
- 2010 E 148th Place
- 1980 E 148th Place
- 14836 Williams St
- 2030 E 148th Place