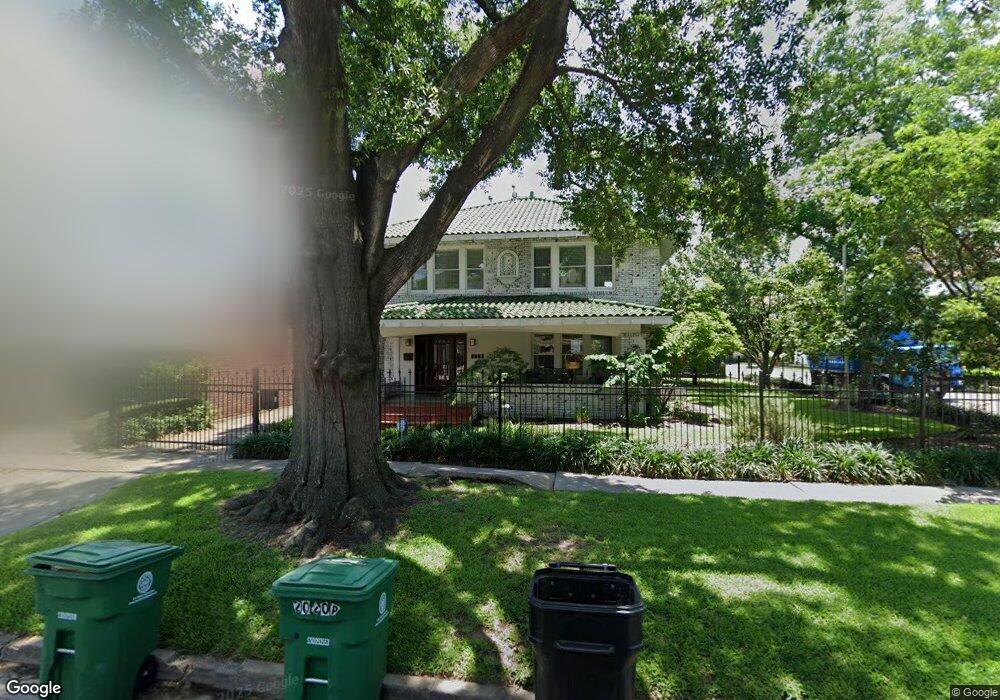
2027 Elmen St Houston, TX 77019
Montrose NeighborhoodEstimated Value: $867,000 - $1,303,000
2
Beds
2
Baths
3,098
Sq Ft
$365/Sq Ft
Est. Value
About This Home
This home is located at 2027 Elmen St, Houston, TX 77019 and is currently estimated at $1,132,247, approximately $365 per square foot. 2027 Elmen St is a home located in Harris County with nearby schools including Baker Montessori, Lanier Middle School, and Lamar High School.
Ownership History
Date
Name
Owned For
Owner Type
Purchase Details
Closed on
Feb 24, 2017
Sold by
Ferrarie Kim
Bought by
Cook Leslie and Cookoniszczuk Alenjandro
Current Estimated Value
Home Financials for this Owner
Home Financials are based on the most recent Mortgage that was taken out on this home.
Original Mortgage
$656,000
Outstanding Balance
$537,523
Interest Rate
3.75%
Mortgage Type
Adjustable Rate Mortgage/ARM
Estimated Equity
$594,724
Purchase Details
Closed on
May 3, 2016
Sold by
Monroe James R
Bought by
Ferrarie Kim E
Home Financials for this Owner
Home Financials are based on the most recent Mortgage that was taken out on this home.
Original Mortgage
$600,000
Interest Rate
3.84%
Mortgage Type
Adjustable Rate Mortgage/ARM
Purchase Details
Closed on
May 22, 1998
Sold by
Mckee Sally
Bought by
Monroe James R and Monroe Janelle D
Home Financials for this Owner
Home Financials are based on the most recent Mortgage that was taken out on this home.
Original Mortgage
$194,400
Interest Rate
7.2%
Create a Home Valuation Report for This Property
The Home Valuation Report is an in-depth analysis detailing your home's value as well as a comparison with similar homes in the area
Home Values in the Area
Average Home Value in this Area
Purchase History
| Date | Buyer | Sale Price | Title Company |
|---|---|---|---|
| Cook Leslie | -- | None Available | |
| Ferrarie Kim E | -- | None Available | |
| Monroe James R | -- | First American Title |
Source: Public Records
Mortgage History
| Date | Status | Borrower | Loan Amount |
|---|---|---|---|
| Open | Cook Leslie | $656,000 | |
| Previous Owner | Ferrarie Kim E | $600,000 | |
| Previous Owner | Monroe James R | $194,400 | |
| Closed | Monroe James R | $24,300 |
Source: Public Records
Tax History Compared to Growth
Tax History
| Year | Tax Paid | Tax Assessment Tax Assessment Total Assessment is a certain percentage of the fair market value that is determined by local assessors to be the total taxable value of land and additions on the property. | Land | Improvement |
|---|---|---|---|---|
| 2025 | $19,591 | $1,300,000 | $906,500 | $393,500 |
| 2024 | $19,591 | $1,220,178 | $906,500 | $313,678 |
| 2023 | $19,591 | $1,177,462 | $906,500 | $270,962 |
| 2022 | $21,741 | $993,930 | $797,720 | $196,210 |
| 2021 | $20,920 | $940,429 | $688,940 | $251,489 |
| 2020 | $19,760 | $816,004 | $581,970 | $234,034 |
| 2019 | $20,387 | $805,665 | $581,970 | $223,695 |
| 2018 | $16,991 | $850,000 | $502,332 | $347,668 |
| 2017 | $27,946 | $1,053,134 | $502,332 | $550,802 |
| 2016 | $22,558 | $1,053,134 | $502,332 | $550,802 |
| 2015 | $10,911 | $1,050,900 | $502,332 | $548,568 |
| 2014 | $10,911 | $759,000 | $477,828 | $281,172 |
Source: Public Records
Map
Nearby Homes
- 2011 Woodhead St
- 2025 Park St
- 2003 Morse St
- 1902 Elmen St
- 1906 Woodhead St
- 2026 Morse St
- 2314 Park St
- 1718 Welch St Unit C
- 1728 Michigan St Unit A
- 1728 Michigan St Unit C
- 1822 Morse St Unit A
- 1808 Ridgewood St
- 1956 Vermont St
- 2103 Hazard St
- 1705 Park St
- 2309 Driscoll St
- 1705 Michigan St
- 2415 Elmen St
- 2008 Hazard St
- 1606 Woodhead St
- 2025 Elmen St
- 2021 Elmen St
- 2019 Elmen St
- 1915 Indiana St
- 1910 Indiana St
- 1910 Indiana St Unit 1-6
- 2017 Elmen St
- 2030 Elmen St
- 2020 Park St Unit B
- 2020 Park St Unit A
- 2102 Park St
- 2020B Park
- 2105 Elmen St
- 1926 Indiana St
- 2028 Elmen St
- 2018 Park St
- 2104 Park St
- 2026 Elmen St
- 1928 Indiana St
- 2013 Elmen St