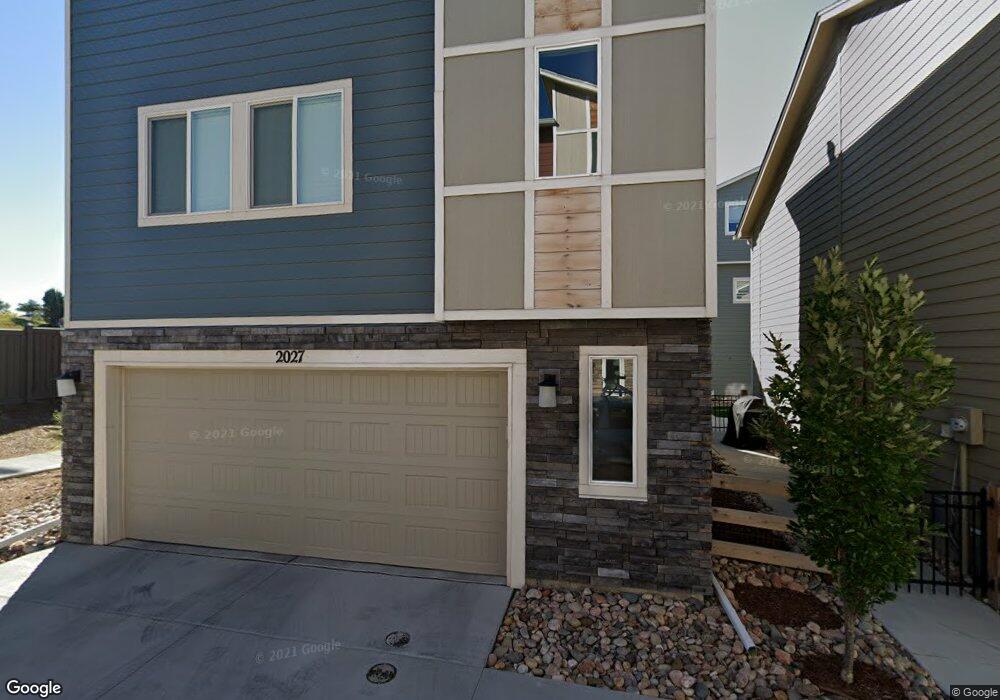
2027 Fulwell View Colorado Springs, CO 80910
Spring Creek NeighborhoodEstimated Value: $399,000 - $459,000
3
Beds
3
Baths
1,940
Sq Ft
$218/Sq Ft
Est. Value
About This Home
This home is located at 2027 Fulwell View, Colorado Springs, CO 80910 and is currently estimated at $422,692, approximately $217 per square foot. 2027 Fulwell View is a home located in El Paso County with nearby schools including Mountain Vista Community School, Harrison High School, and Atlas Preparatory High School.
Ownership History
Date
Name
Owned For
Owner Type
Purchase Details
Closed on
Nov 24, 2021
Sold by
Kitchel Steffenie
Bought by
Jairamani Ajeet and Jairamani Rakhee
Current Estimated Value
Home Financials for this Owner
Home Financials are based on the most recent Mortgage that was taken out on this home.
Original Mortgage
$315,000
Outstanding Balance
$289,484
Interest Rate
3.05%
Mortgage Type
New Conventional
Estimated Equity
$133,208
Purchase Details
Closed on
Aug 24, 2020
Sold by
Jones Hannah
Bought by
Kitchel Steffenie
Home Financials for this Owner
Home Financials are based on the most recent Mortgage that was taken out on this home.
Original Mortgage
$338,772
Interest Rate
3%
Mortgage Type
VA
Purchase Details
Closed on
May 14, 2019
Sold by
Challenger Colorado Llc
Bought by
Jones Hannah
Home Financials for this Owner
Home Financials are based on the most recent Mortgage that was taken out on this home.
Original Mortgage
$301,240
Interest Rate
4%
Mortgage Type
VA
Create a Home Valuation Report for This Property
The Home Valuation Report is an in-depth analysis detailing your home's value as well as a comparison with similar homes in the area
Home Values in the Area
Average Home Value in this Area
Purchase History
| Date | Buyer | Sale Price | Title Company |
|---|---|---|---|
| Jairamani Ajeet | $420,000 | Legacy Title Group Llc | |
| Kitchel Steffenie | $327,000 | Unified Title Co | |
| Jones Hannah | $294,900 | Legacy Title Group |
Source: Public Records
Mortgage History
| Date | Status | Borrower | Loan Amount |
|---|---|---|---|
| Open | Jairamani Ajeet | $315,000 | |
| Previous Owner | Kitchel Steffenie | $338,772 | |
| Previous Owner | Jones Hannah | $301,240 |
Source: Public Records
Tax History Compared to Growth
Tax History
| Year | Tax Paid | Tax Assessment Tax Assessment Total Assessment is a certain percentage of the fair market value that is determined by local assessors to be the total taxable value of land and additions on the property. | Land | Improvement |
|---|---|---|---|---|
| 2025 | $1,300 | $28,230 | -- | -- |
| 2024 | $1,018 | $26,120 | $3,570 | $22,550 |
| 2023 | $1,018 | $26,120 | $3,570 | $22,550 |
| 2022 | $1,172 | $21,730 | $3,060 | $18,670 |
| 2021 | $1,252 | $22,360 | $3,150 | $19,210 |
| 2020 | $1,109 | $17,020 | $2,470 | $14,550 |
| 2019 | $459 | $6,840 | $2,470 | $4,370 |
Source: Public Records
Map
Nearby Homes
- 2184 Backpack Point
- 1970 Lambourne St
- 2148 Backpack Point
- 1962 Lambourne St
- 1954 Lambourne St
- 1965 Abbington St
- 1922 Lambourne St
- 1804 Final View Alley
- 1437 Grand Overlook St
- 2035 Corker View
- 2152 Gilpin Ave
- 1466 Kirkham St
- 1648 Grand Overlook St
- 2305 Falkirk Dr
- 1632 Derbyshire St
- 1406 Kirkham St
- 2257 Ellingwood Dr
- 2258 Downend St
- 2122 Phillips Alley
- 2147 Saint Claire Park Alley
- 2017 Fulwell View
- 2028 Fulwell View
- 2018 Fulwell View
- 2020 Gaffer Point
- 2030 Gaffer Point
- 2007 Fulwell View
- 2010 Gaffer Point
- 2008 Fulwell View
- 2019 Gaffer Point
- 2015 Paddy Grove
- 2005 Paddy Grove
- 2029 Gaffer Point
- 2025 Paddy Grove
- 2009 Gaffer Point
- 2026 Paddy Grove
- 2006 Paddy Grove
- 2016 Paddy Grove
- 1985 Abbington St
- 2033 Rozzer View
- 2023 Rozzer View