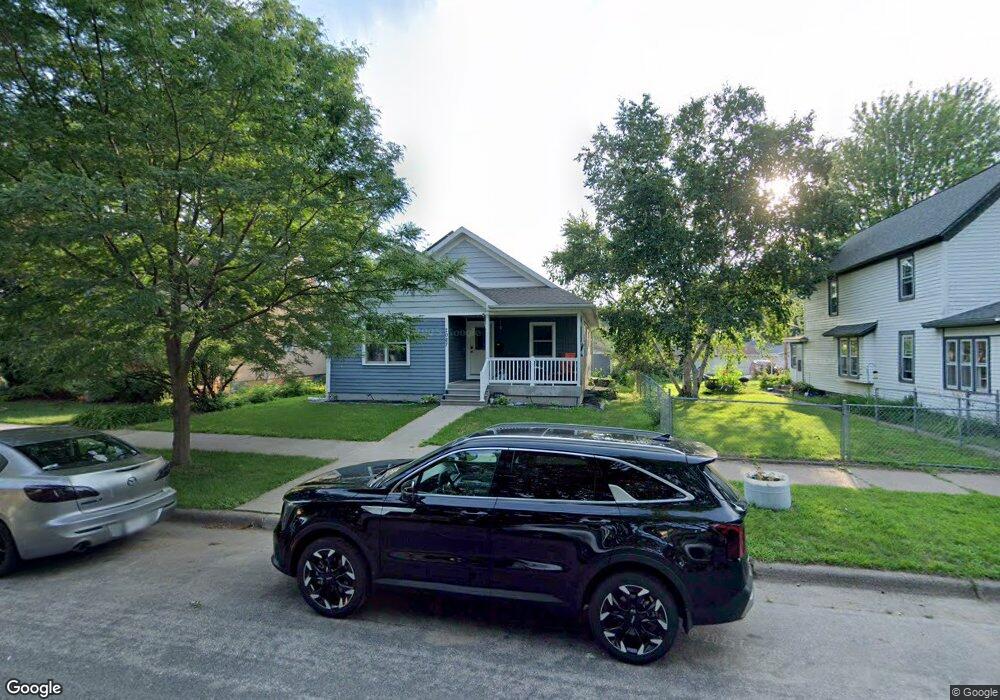
2027 Kane St La Crosse, WI 54603
Logan Northside NeighborhoodEstimated Value: $297,006 - $313,000
2
Beds
2
Baths
1,436
Sq Ft
$213/Sq Ft
Est. Value
About This Home
This home is located at 2027 Kane St, La Crosse, WI 54603 and is currently estimated at $306,002, approximately $213 per square foot. 2027 Kane St is a home located in La Crosse County with nearby schools including Northside Elementary School, Logan Middle School, and Logan High School.
Ownership History
Date
Name
Owned For
Owner Type
Purchase Details
Closed on
Aug 31, 2021
Sold by
Helgeson Zachary S and Helgeson Jenna
Bought by
Jungmann Scott A and Jungmann Margaret F
Current Estimated Value
Home Financials for this Owner
Home Financials are based on the most recent Mortgage that was taken out on this home.
Original Mortgage
$172,975
Outstanding Balance
$155,060
Interest Rate
2.7%
Mortgage Type
FHA
Estimated Equity
$150,942
Purchase Details
Closed on
May 25, 2012
Sold by
City Of La Crosse
Bought by
Helgeson Zachary S
Home Financials for this Owner
Home Financials are based on the most recent Mortgage that was taken out on this home.
Original Mortgage
$61,500
Interest Rate
3.87%
Mortgage Type
New Conventional
Purchase Details
Closed on
Sep 8, 2009
Sold by
Heyming May
Bought by
City Of La Crosse
Create a Home Valuation Report for This Property
The Home Valuation Report is an in-depth analysis detailing your home's value as well as a comparison with similar homes in the area
Home Values in the Area
Average Home Value in this Area
Purchase History
| Date | Buyer | Sale Price | Title Company |
|---|---|---|---|
| Jungmann Scott A | $240,000 | New Castle Title | |
| Helgeson Zachary S | -- | None Available | |
| City Of La Crosse | $31,000 | None Available |
Source: Public Records
Mortgage History
| Date | Status | Borrower | Loan Amount |
|---|---|---|---|
| Open | Jungmann Scott A | $172,975 | |
| Previous Owner | Helgeson Zachary S | $61,500 |
Source: Public Records
Tax History
| Year | Tax Paid | Tax Assessment Tax Assessment Total Assessment is a certain percentage of the fair market value that is determined by local assessors to be the total taxable value of land and additions on the property. | Land | Improvement |
|---|---|---|---|---|
| 2025 | $5,624 | $321,700 | $27,100 | $294,600 |
| 2024 | $5,316 | $255,300 | $20,100 | $235,200 |
| 2023 | $4,933 | $255,300 | $20,100 | $235,200 |
| 2022 | $4,719 | $255,300 | $20,100 | $235,200 |
| 2021 | $5,035 | $206,200 | $20,100 | $186,100 |
| 2020 | $5,036 | $206,200 | $20,100 | $186,100 |
| 2019 | $5,211 | $206,200 | $20,100 | $186,100 |
| 2018 | $4,903 | $170,800 | $19,200 | $151,600 |
| 2017 | $4,897 | $170,800 | $19,200 | $151,600 |
| 2016 | $4,845 | $166,500 | $19,200 | $147,300 |
| 2015 | $4,769 | $166,500 | $19,200 | $147,300 |
| 2014 | $4,754 | $166,500 | $19,200 | $147,300 |
| 2013 | $4,897 | $166,500 | $19,200 | $147,300 |
Source: Public Records
Map
Nearby Homes
- 701 George St
- 1911 Liberty St
- 1642 Kane St
- 1639 Liberty St
- 2006 Prospect St
- 1830 Prospect St
- 1611 Avon St
- 2339 Loomis St
- 1539 Rose St
- 2427 Loomis St
- 1452 George St
- 1433 Kane St
- 404 Gillette St Unit B
- 1501 Rose St Unit 14
- 1422 Rose St
- 2830 Harvey St
- 1821 Caroline St
- 825 George St
- 1608 Caroline St
- 0 Tellin Ct Unit 1617243
Your Personal Tour Guide
Ask me questions while you tour the home.