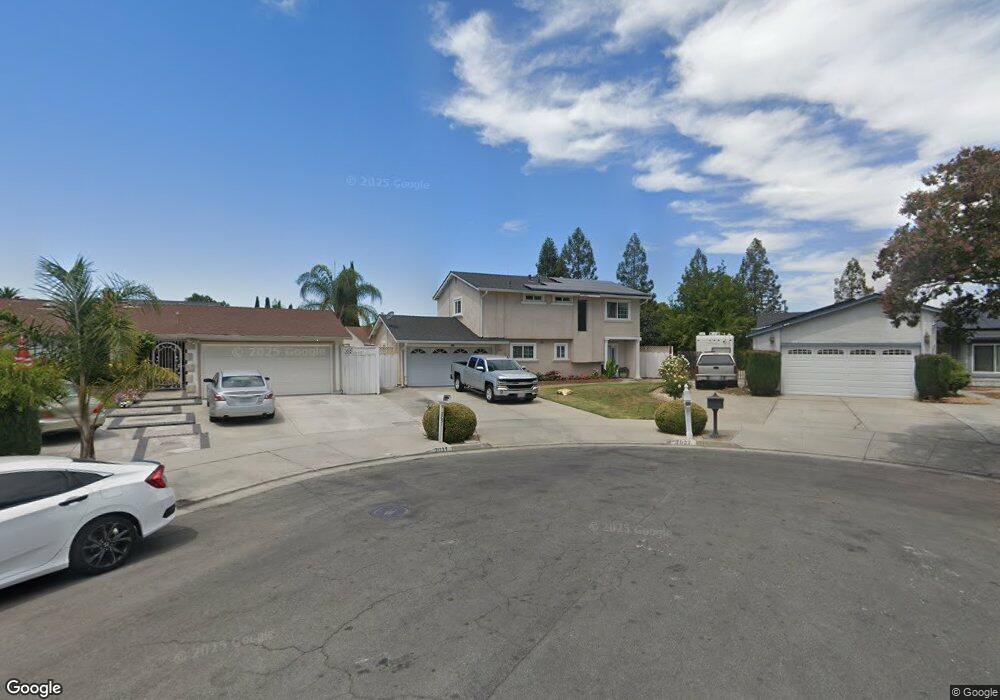
2027 Starfish Ct San Jose, CA 95148
Ocala-Sundown NeighborhoodEstimated Value: $1,174,000 - $1,389,000
About This Home
This home is located at 2027 Starfish Ct, San Jose, CA 95148 and is currently estimated at $1,276,417, approximately $806 per square foot. 2027 Starfish Ct is a home located in Santa Clara County with nearby schools including Thomas P. Ryan Elementary School, Ocala Middle School, and Mt. Pleasant High School.
Ownership History
We collect this data history from publicly available records. To have your information removed, we recommend requesting removal directly through your county’s website.
Purchase Details
Home Financials for this Owner
Home Financials are based on the most recent Mortgage that was taken out on this home.Purchase Details
Home Values in the Area
Average Home Value in this Area
Purchase History
We collect this data history from publicly available records. To have your information removed, we recommend requesting removal directly through your county’s website.
| Date | Buyer | Sale Price | Title Company |
|---|---|---|---|
| -- | First American Title Company | ||
| -- | None Available |
Mortgage History
We collect this data history from publicly available records. To have your information removed, we recommend requesting removal directly through your county’s website.
| Date | Status | Borrower | Loan Amount |
|---|---|---|---|
| Closed | $447,805 |
Tax History
We collect this data history from publicly available records. To have your information removed, we recommend requesting removal directly through your county’s website.
| Year | Tax Paid | Tax Assessment Tax Assessment Total Assessment is a certain percentage of the fair market value that is determined by local assessors to be the total taxable value of land and additions on the property. | Land | Improvement |
|---|---|---|---|---|
| 2025 | $5,309 | $238,924 | $75,652 | $163,272 |
| 2024 | $5,309 | $234,240 | $74,169 | $160,071 |
| 2023 | $5,159 | $229,648 | $72,715 | $156,933 |
| 2022 | $5,049 | $225,146 | $71,290 | $153,856 |
| 2021 | $4,827 | $220,733 | $69,893 | $150,840 |
| 2020 | $4,626 | $218,471 | $69,177 | $149,294 |
| 2019 | $4,460 | $214,188 | $67,821 | $146,367 |
| 2018 | $4,370 | $209,990 | $66,492 | $143,498 |
| 2017 | $4,347 | $205,874 | $65,189 | $140,685 |
| 2016 | $4,117 | $201,838 | $63,911 | $137,927 |
| 2015 | $3,712 | $198,807 | $62,951 | $135,856 |
| 2014 | -- | $194,913 | $61,718 | $133,195 |
Map
- 2022 Gana Ct
- 2966 Ridgemont Dr
- 1765 S White Rd
- 3146 Marten Ave
- 3143 Cunningham Lake Ct
- 2029 Hayworth Dr
- 1805 Home Gate Dr
- 2788 Tanglewood Dr
- 1472 Mount Whitney Dr
- 3267 Sueno Dr
- 3323 Prado Ln
- 2521 Coconut Dr
- 3331 Sueno Dr
- 2873 Glen Frost Ct
- 2184 Fairmont Ct
- 3410 Gila Dr
- 1219 Farringdon Dr
- 1582 Fall Ave
- 1894 Winding Creek Ct
- 3033 Peppermint Dr
- 3023 Moonstar Ct
- 3019 Moonstar Ct
- 3027 Moonstar Ct
- 3028 Bluewater Ct
- 3024 Bluewater Ct
- 3015 Moonstar Ct
- 3020 Bluewater Ct
- 3031 Moonstar Ct
- 3032 Bluewater Ct
- 3018 Moonstar Ct
- 3030 Moonstar Ct
- 3016 Bluewater Ct
- 3022 Moonstar Ct
- 3011 Moonstar Ct
- 3026 Moonstar Ct
- 3014 Moonstar Ct
- 3036 Bluewater Ct
- 3012 Bluewater Ct
- 3010 Moonstar Ct
- 3007 Moonstar Ct
Ask me questions while you tour the home.