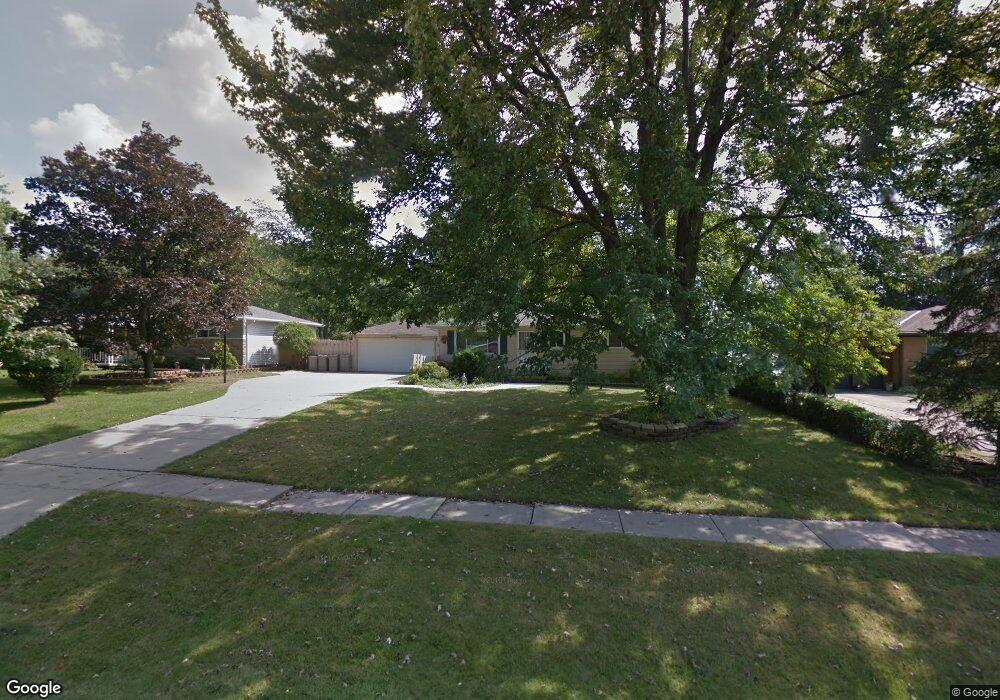
20279 Westwood Park Blvd Strongsville, OH 44149
Estimated Value: $212,000 - $247,000
3
Beds
1
Bath
1,014
Sq Ft
$232/Sq Ft
Est. Value
About This Home
This home is located at 20279 Westwood Park Blvd, Strongsville, OH 44149 and is currently estimated at $235,408, approximately $232 per square foot. 20279 Westwood Park Blvd is a home located in Cuyahoga County with nearby schools including Strongsville High School, Strongsville Academy, and Sts Joseph & John Interparochial School.
Ownership History
Date
Name
Owned For
Owner Type
Purchase Details
Closed on
Sep 29, 2004
Sold by
Krivanek Timothy G
Bought by
Krivanek Timothy G and Krivanek Beth
Current Estimated Value
Purchase Details
Closed on
Dec 1, 1998
Sold by
Pirosko Tracy L and Sanek Aaron W
Bought by
Krivanek Timohy G
Home Financials for this Owner
Home Financials are based on the most recent Mortgage that was taken out on this home.
Original Mortgage
$90,000
Outstanding Balance
$19,076
Interest Rate
6%
Estimated Equity
$216,332
Purchase Details
Closed on
Jul 8, 1997
Sold by
Hulsman Arthur J
Bought by
Pirosko Tracy L and Sanek Aaron W
Home Financials for this Owner
Home Financials are based on the most recent Mortgage that was taken out on this home.
Original Mortgage
$83,500
Interest Rate
8.01%
Mortgage Type
New Conventional
Purchase Details
Closed on
Feb 16, 1978
Sold by
Hulsman Arthur J and Hulsman B
Bought by
Hulsman Arthur J
Purchase Details
Closed on
Jan 1, 1975
Bought by
Hulsman Arthur J and Hulsman B
Create a Home Valuation Report for This Property
The Home Valuation Report is an in-depth analysis detailing your home's value as well as a comparison with similar homes in the area
Home Values in the Area
Average Home Value in this Area
Purchase History
| Date | Buyer | Sale Price | Title Company |
|---|---|---|---|
| Krivanek Timothy G | -- | Attorney | |
| Krivanek Timohy G | $117,000 | -- | |
| Pirosko Tracy L | $113,500 | -- | |
| Hulsman Arthur J | -- | -- | |
| Hulsman Arthur J | -- | -- |
Source: Public Records
Mortgage History
| Date | Status | Borrower | Loan Amount |
|---|---|---|---|
| Open | Krivanek Timohy G | $90,000 | |
| Previous Owner | Pirosko Tracy L | $83,500 |
Source: Public Records
Tax History Compared to Growth
Tax History
| Year | Tax Paid | Tax Assessment Tax Assessment Total Assessment is a certain percentage of the fair market value that is determined by local assessors to be the total taxable value of land and additions on the property. | Land | Improvement |
|---|---|---|---|---|
| 2024 | $3,209 | $68,355 | $13,125 | $55,230 |
| 2023 | $3,572 | $57,050 | $13,650 | $43,400 |
| 2022 | $3,546 | $57,050 | $13,650 | $43,400 |
| 2021 | $3,518 | $57,050 | $13,650 | $43,400 |
| 2020 | $3,260 | $46,760 | $11,200 | $35,560 |
| 2019 | $3,164 | $133,600 | $32,000 | $101,600 |
| 2018 | $2,872 | $46,760 | $11,200 | $35,560 |
| 2017 | $2,838 | $42,780 | $9,560 | $33,220 |
| 2016 | $2,815 | $42,780 | $9,560 | $33,220 |
| 2015 | $2,771 | $42,780 | $9,560 | $33,220 |
| 2014 | $2,771 | $41,520 | $9,280 | $32,240 |
Source: Public Records
Map
Nearby Homes
- 13236 Tomson Dr
- 12651 Alameda Dr
- 20078 Trapper Trail
- 19620 Porters Ln Unit 15F
- 14112 Settlers Way
- 12694 Ionia Ct
- 14400 Prospect Rd
- 12647 Edgepark Cir
- 13156 Olympus Way
- 13066 Olympus Way
- 13099 Olympus Way
- 14896 Britannia Ct
- 15017 Regency Dr
- 12385 Corinth Ct
- 12539 Olympus Way
- 14890 Prospect Rd
- 22125 Olde Creek Trail
- 19160 Wheelers Ln
- 15001 Scarlet Oak Trail
- 20678 Spruce Dr
- 20307 Westwood Park Blvd
- 20337 Westwood Park Blvd
- 20304 Collier Dr
- 13549 Tomson Dr
- 20367 Westwood Park Blvd
- 20280 Collier Dr
- 20328 Collier Dr
- 13548 Tomson Dr
- 13505 Tomson Dr
- 20399 Westwood Park Blvd
- 13504 Tomson Dr
- 20352 Collier Dr
- 13463 Tomson Dr
- 20293 Collier Dr
- 20407 Westwood Park Blvd
- 13462 Tomson Dr
- 13549 Yager Dr
- 20376 Collier Dr
- 20317 Collier Dr
- 20435 Westwood Park Blvd