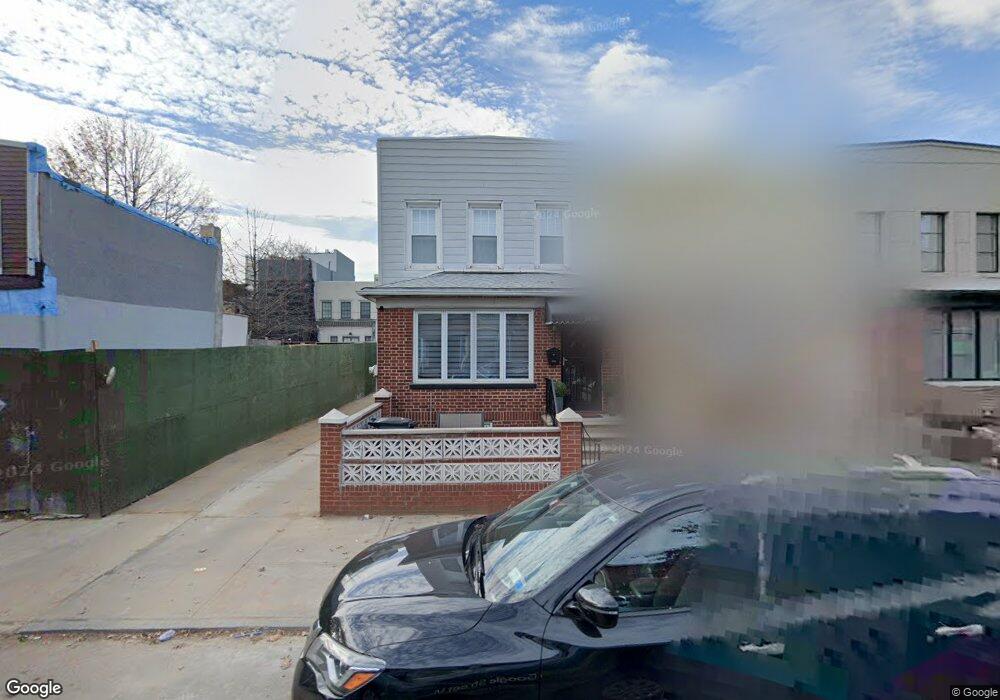
2028 58th St Brooklyn, NY 11204
Borough Park NeighborhoodEstimated Value: $1,138,000 - $1,535,000
--
Bed
--
Bath
1,369
Sq Ft
$979/Sq Ft
Est. Value
About This Home
This home is located at 2028 58th St, Brooklyn, NY 11204 and is currently estimated at $1,340,097, approximately $978 per square foot. 2028 58th St is a home located in Kings County with nearby schools including P.S. 121 Nelson A Rockefeller, Franklin Delano Roosevelt High School, and Barkai Yeshivah.
Ownership History
Date
Name
Owned For
Owner Type
Purchase Details
Closed on
Apr 11, 2018
Sold by
Mary Fetsick Greenspan Trust
Bought by
Kraus Mordechai and Kraus Raizy
Current Estimated Value
Home Financials for this Owner
Home Financials are based on the most recent Mortgage that was taken out on this home.
Original Mortgage
$784,000
Outstanding Balance
$674,540
Interest Rate
4.46%
Mortgage Type
Purchase Money Mortgage
Estimated Equity
$665,557
Purchase Details
Closed on
Aug 25, 1993
Sold by
Greenspan Mary Fetsick
Bought by
Greenspan Mary Fetsick
Create a Home Valuation Report for This Property
The Home Valuation Report is an in-depth analysis detailing your home's value as well as a comparison with similar homes in the area
Home Values in the Area
Average Home Value in this Area
Purchase History
| Date | Buyer | Sale Price | Title Company |
|---|---|---|---|
| Kraus Mordechai | $980,000 | -- | |
| Greenspan Mary Fetsick | -- | -- |
Source: Public Records
Mortgage History
| Date | Status | Borrower | Loan Amount |
|---|---|---|---|
| Open | Kraus Mordechai | $784,000 |
Source: Public Records
Tax History Compared to Growth
Tax History
| Year | Tax Paid | Tax Assessment Tax Assessment Total Assessment is a certain percentage of the fair market value that is determined by local assessors to be the total taxable value of land and additions on the property. | Land | Improvement |
|---|---|---|---|---|
| 2025 | $7,077 | $75,660 | $18,600 | $57,060 |
| 2024 | $7,077 | $59,760 | $18,600 | $41,160 |
| 2023 | $6,810 | $64,980 | $18,600 | $46,380 |
| 2022 | $6,351 | $70,380 | $18,600 | $51,780 |
| 2021 | $6,334 | $70,320 | $18,600 | $51,720 |
| 2020 | $4,750 | $58,800 | $18,600 | $40,200 |
| 2019 | $5,483 | $64,740 | $18,600 | $46,140 |
| 2018 | $5,038 | $27,945 | $8,157 | $19,788 |
| 2017 | $4,758 | $26,512 | $8,170 | $18,342 |
| 2016 | $2,638 | $25,081 | $9,780 | $15,301 |
| 2015 | $1,522 | $25,081 | $12,308 | $12,773 |
| 2014 | $1,522 | $24,468 | $13,642 | $10,826 |
Source: Public Records
Map
Nearby Homes