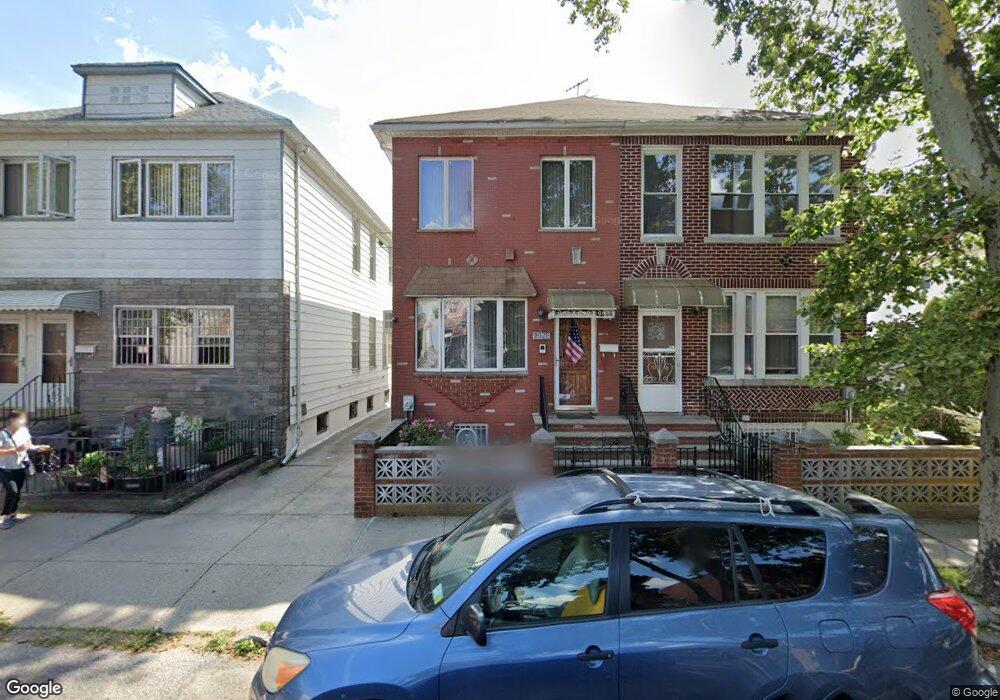
2028 73rd St Brooklyn, NY 11204
Bensonhurst NeighborhoodEstimated Value: $1,049,341 - $1,424,000
Studio
--
Bath
1,344
Sq Ft
$897/Sq Ft
Est. Value
About This Home
This home is located at 2028 73rd St, Brooklyn, NY 11204 and is currently estimated at $1,205,835, approximately $897 per square foot. 2028 73rd St is a home located in Kings County with nearby schools including P.S. 247 The College Partnership Elementary School, Seth Low Intermediate School 96, and James Madison High School.
Ownership History
Date
Name
Owned For
Owner Type
Purchase Details
Closed on
Nov 18, 2022
Sold by
Kong Cherun Mon and Kong Karen
Bought by
Kong Cherun Mon and Kong Karen
Current Estimated Value
Purchase Details
Closed on
Jan 24, 2005
Sold by
Spatola Francesca
Bought by
Kong Cherun Mon and Kong Karen
Home Financials for this Owner
Home Financials are based on the most recent Mortgage that was taken out on this home.
Original Mortgage
$240,000
Outstanding Balance
$122,149
Interest Rate
5.77%
Mortgage Type
Purchase Money Mortgage
Estimated Equity
$1,083,686
Create a Home Valuation Report for This Property
The Home Valuation Report is an in-depth analysis detailing your home's value as well as a comparison with similar homes in the area
Home Values in the Area
Average Home Value in this Area
Purchase History
| Date | Buyer | Sale Price | Title Company |
|---|---|---|---|
| Kong Cherun Mon | -- | -- | |
| Kong Cherun Mon | $585,000 | -- |
Source: Public Records
Mortgage History
| Date | Status | Borrower | Loan Amount |
|---|---|---|---|
| Open | Kong Cherun Mon | $240,000 |
Source: Public Records
Tax History
| Year | Tax Paid | Tax Assessment Tax Assessment Total Assessment is a certain percentage of the fair market value that is determined by local assessors to be the total taxable value of land and additions on the property. | Land | Improvement |
|---|---|---|---|---|
| 2025 | $7,601 | $60,000 | $11,580 | $48,420 |
| 2024 | $7,601 | $53,100 | $11,580 | $41,520 |
| 2023 | $7,235 | $58,920 | $11,580 | $47,340 |
| 2022 | $6,707 | $52,260 | $11,580 | $40,680 |
| 2021 | $6,909 | $52,920 | $11,580 | $41,340 |
| 2020 | $3,309 | $53,460 | $11,580 | $41,880 |
| 2019 | $6,548 | $53,460 | $11,580 | $41,880 |
| 2018 | $5,992 | $30,854 | $6,774 | $24,080 |
| 2017 | $5,652 | $29,196 | $8,385 | $20,811 |
| 2016 | $5,394 | $28,531 | $7,492 | $21,039 |
| 2015 | $3,102 | $27,536 | $8,382 | $19,154 |
| 2014 | $3,102 | $27,253 | $9,952 | $17,301 |
Source: Public Records
Map
Nearby Homes
Your Personal Tour Guide
Ask me questions while you tour the home.