Estimated Value: $109,510 - $139,000
3
Beds
1
Bath
1,300
Sq Ft
$95/Sq Ft
Est. Value
About This Home
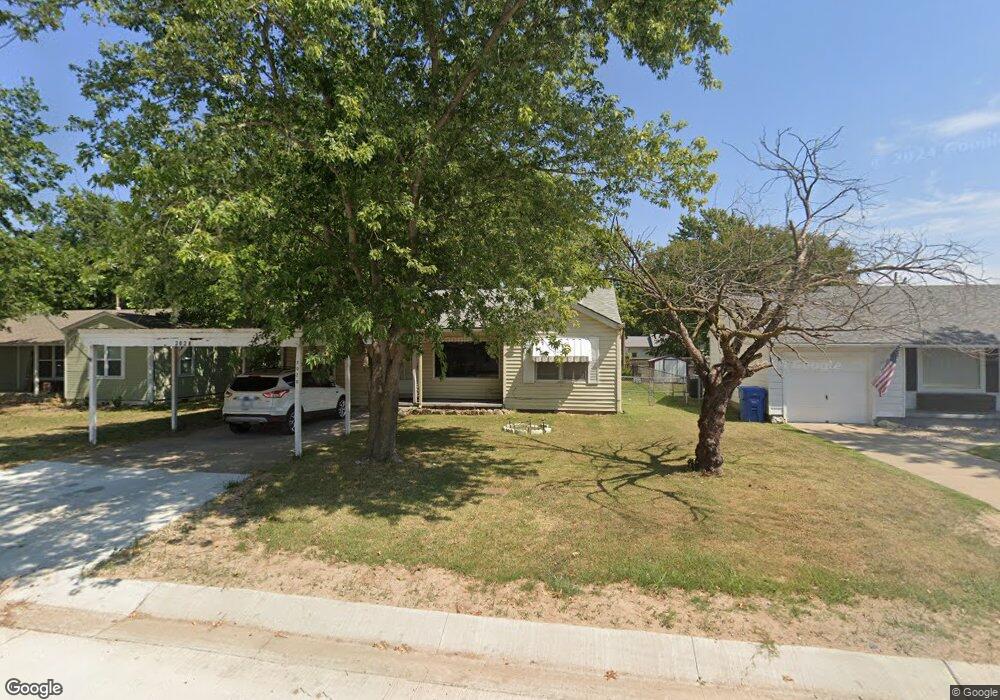
This home is located at 2028 A St NE, Miami, OK 74354 and is currently estimated at $123,628, approximately $95 per square foot. 2028 A St NE is a home located in Ottawa County with nearby schools including Miami High School and Mt. Olive Lutheran School.
Ownership History
Date
Name
Owned For
Owner Type
Purchase Details
Closed on
Mar 24, 2008
Sold by
Heyburn James M and Heyburn Carrie A
Bought by
Pritchard Daniel L and Pritchard Holly C
Current Estimated Value
Home Financials for this Owner
Home Financials are based on the most recent Mortgage that was taken out on this home.
Original Mortgage
$56,000
Outstanding Balance
$34,756
Interest Rate
5.67%
Mortgage Type
Purchase Money Mortgage
Estimated Equity
$88,872
Purchase Details
Closed on
Dec 30, 2005
Sold by
Burnett Leland T and Burnett Nancy P
Bought by
Pritchard Daniel L and Pritchard Holly C
Purchase Details
Closed on
Nov 16, 2005
Sold by
Burnett Curtis E and Burnett Leland T
Bought by
Burnett Leland T and Burnett Nancy P
Purchase Details
Closed on
Dec 4, 2000
Bought by
Burnett Curtis and Burnett Leland
Purchase Details
Closed on
May 28, 1993
Bought by
Fields Roger and Fields Shelley D
Create a Home Valuation Report for This Property
The Home Valuation Report is an in-depth analysis detailing your home's value as well as a comparison with similar homes in the area
Home Values in the Area
Average Home Value in this Area
Purchase History
| Date | Buyer | Sale Price | Title Company |
|---|---|---|---|
| Pritchard Daniel L | $26,500 | None Available | |
| Pritchard Daniel L | $46,000 | Photo Abstract Co | |
| Burnett Leland T | -- | None Available | |
| Burnett Curtis | $41,500 | -- | |
| Fields Roger | -- | -- |
Source: Public Records
Mortgage History
| Date | Status | Borrower | Loan Amount |
|---|---|---|---|
| Open | Pritchard Daniel L | $56,000 |
Source: Public Records
Tax History Compared to Growth
Tax History
| Year | Tax Paid | Tax Assessment Tax Assessment Total Assessment is a certain percentage of the fair market value that is determined by local assessors to be the total taxable value of land and additions on the property. | Land | Improvement |
|---|---|---|---|---|
| 2025 | $698 | $6,540 | $456 | $6,084 |
| 2024 | $698 | $7,244 | $456 | $6,788 |
| 2023 | $698 | $8,093 | $456 | $7,637 |
| 2022 | $713 | $7,708 | $456 | $7,252 |
| 2021 | $694 | $7,341 | $456 | $6,885 |
| 2020 | $666 | $6,991 | $456 | $6,535 |
| 2019 | $547 | $6,658 | $456 | $6,202 |
| 2018 | $524 | $6,341 | $456 | $5,885 |
| 2017 | $507 | $6,039 | $456 | $5,583 |
| 2016 | $462 | $5,752 | $456 | $5,296 |
| 2015 | $420 | $4,731 | $476 | $4,255 |
| 2014 | $449 | $5,477 | $513 | $4,964 |
Source: Public Records
Map
Nearby Homes
- 2220 B St NE
- 1916 A St NE
- 1839 D St NE
- 1821 C St NE
- 1644 D St NE
- 1525 N Main St
- 1902 G St NW
- 2101 Birnamwood Dr
- 1934 Birnamwood Dr
- 1300 Maple Dr
- 1311 Park Heights St
- 1209 B St NW
- 2405 Molly Ln
- 416 Admiral Trussler Blvd
- 1611 Woodlawn Dr
- 1408 Morgan Cir
- 706 Coyne St
- 935 Pine St
- 411 E Bj Tunnell Blvd
- 936 Pine St