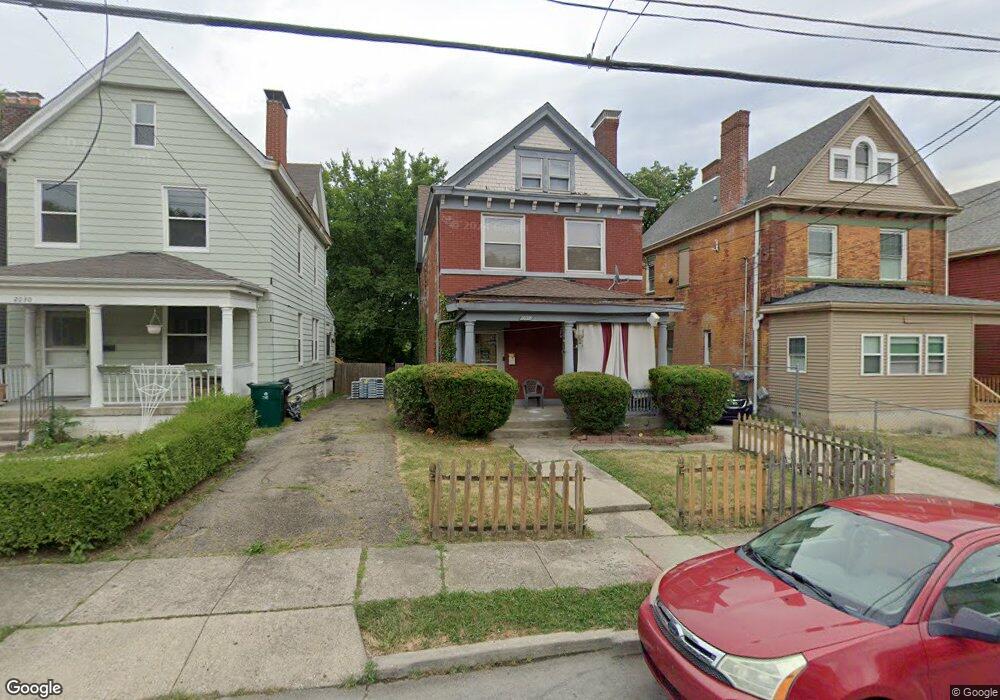
2028 Burnet Ave Cincinnati, OH 45219
Mount Auburn NeighborhoodEstimated Value: $162,000 - $318,423
5
Beds
2
Baths
2,448
Sq Ft
$93/Sq Ft
Est. Value
About This Home
This home is located at 2028 Burnet Ave, Cincinnati, OH 45219 and is currently estimated at $226,606, approximately $92 per square foot. 2028 Burnet Ave is a home located in Hamilton County with nearby schools including William H. Taft Elementary School, Robert A. Taft Information Technology High School, and Clark Montessori High School.
Ownership History
Date
Name
Owned For
Owner Type
Purchase Details
Closed on
Sep 2, 2025
Sold by
Kelly Higgins
Bought by
Equity Opportunities-Capital Investment Llc
Current Estimated Value
Home Financials for this Owner
Home Financials are based on the most recent Mortgage that was taken out on this home.
Original Mortgage
$127,500
Outstanding Balance
$85,949
Interest Rate
6.74%
Mortgage Type
Construction
Estimated Equity
$140,657
Purchase Details
Closed on
Jul 27, 2018
Sold by
Estate Of Elaime M Kelly
Bought by
Kelly Higgines
Purchase Details
Closed on
Apr 8, 2005
Sold by
Kelly Higgins
Bought by
Kelly Elaine
Purchase Details
Closed on
Jan 10, 2005
Sold by
Mack James and Mack Cherita R
Bought by
Kelly Elaine
Purchase Details
Closed on
Aug 29, 2003
Sold by
Jones Malissa A and Jones Vincent
Bought by
Mack James
Home Financials for this Owner
Home Financials are based on the most recent Mortgage that was taken out on this home.
Original Mortgage
$46,800
Interest Rate
5.69%
Mortgage Type
Unknown
Purchase Details
Closed on
Jul 31, 1998
Sold by
Houston Jr Charles E
Bought by
Jones Malissa A
Create a Home Valuation Report for This Property
The Home Valuation Report is an in-depth analysis detailing your home's value as well as a comparison with similar homes in the area
Home Values in the Area
Average Home Value in this Area
Purchase History
| Date | Buyer | Sale Price | Title Company |
|---|---|---|---|
| Equity Opportunities-Capital Investment Llc | $150,000 | None Listed On Document | |
| Kelly Higgines | -- | None Available | |
| Kelly Elaine | -- | None Available | |
| Kelly Elaine | $115,000 | Classic Title Agency Llc | |
| Mack James | $52,000 | -- | |
| Jones Malissa A | $62,400 | -- |
Source: Public Records
Mortgage History
| Date | Status | Borrower | Loan Amount |
|---|---|---|---|
| Open | Equity Opportunities-Capital Investment Llc | $127,500 | |
| Previous Owner | Mack James | $46,800 |
Source: Public Records
Tax History
| Year | Tax Paid | Tax Assessment Tax Assessment Total Assessment is a certain percentage of the fair market value that is determined by local assessors to be the total taxable value of land and additions on the property. | Land | Improvement |
|---|---|---|---|---|
| 2025 | $3,130 | $49,294 | $9,527 | $39,767 |
| 2024 | $3,126 | $49,294 | $9,527 | $39,767 |
| 2023 | $3,132 | $49,294 | $9,527 | $39,767 |
| 2022 | $1,610 | $23,552 | $5,432 | $18,120 |
| 2021 | $1,548 | $23,552 | $5,432 | $18,120 |
| 2020 | $1,593 | $23,552 | $5,432 | $18,120 |
| 2019 | $1,527 | $20,658 | $4,764 | $15,894 |
| 2018 | $1,530 | $20,658 | $4,764 | $15,894 |
| 2017 | $1,453 | $20,658 | $4,764 | $15,894 |
| 2016 | $1,651 | $23,149 | $4,746 | $18,403 |
| 2015 | $1,489 | $23,149 | $4,746 | $18,403 |
| 2014 | $1,499 | $23,149 | $4,746 | $18,403 |
| 2013 | $1,467 | $22,260 | $4,564 | $17,696 |
Source: Public Records
Map
Nearby Homes
- 2014 Highland Ave
- 336 Dorchester Ave
- 2117 Highland Ave
- 2207 Burnet Ave
- 2231 Burnet Ave
- 2213 Highland Ave
- 2228 Maplewood Ave
- 316 Mcgregor Ave
- 224 Dorchester Ave
- 1948 Bigelow St
- 1944 Bigelow St
- 2320 Maplewood Ave
- 1946 Bigelow St
- 1940 Bigelow St
- 1942 Bigelow St
- 1938 Bigelow St
- 548 Slack St
- 540 Slack St
- 2344 Highland Ave
- 1911 Auburn Ave
- 2030 Burnet Ave
- 2026 Burnet Ave
- 2024 Burnet Ave
- 2032 Burnet Ave
- 2022 Burnet Ave
- 2031 Ryan Ave
- 2029 Ryan Ave
- 2033 Ryan Ave
- 2027 Ryan Ave
- 2020 Burnet Ave
- 2045 Burnet Ave
- 2025 Ryan Ave
- 2105 Burnet Ave
- 2105 Burnet Ave Unit SI ID1056017P
- 2105 Burnet Ave Unit ID1056017P
- 2041 Burnet Ave
- 2107 Burnet Ave
- 2018 Burnet Ave
- 2018 Burnet Ave Unit 2
- 2018 Burnet Ave Unit 1
Your Personal Tour Guide
Ask me questions while you tour the home.