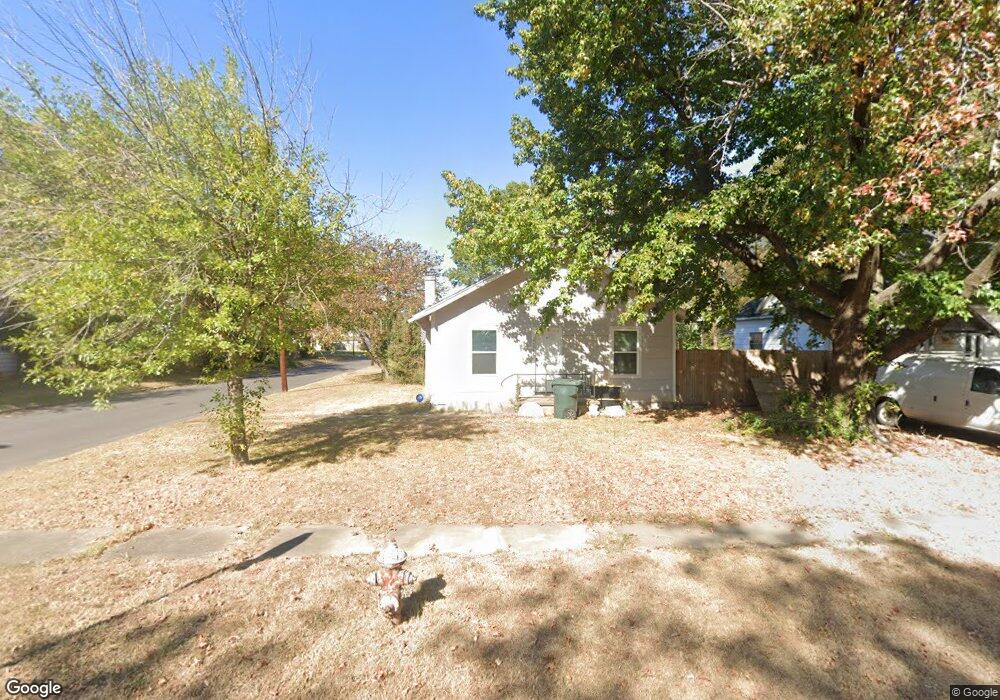
2028 Columbus St Muskogee, OK 74401
Central Muskogee NeighborhoodEstimated Value: $77,665 - $115,000
3
Beds
1
Bath
1,492
Sq Ft
$60/Sq Ft
Est. Value
About This Home
This home is located at 2028 Columbus St, Muskogee, OK 74401 and is currently estimated at $89,916, approximately $60 per square foot. 2028 Columbus St is a home located in Muskogee County with nearby schools including Cherokee Elementary School, 8th & 9th Grade Academy @ Alice Robertson, and Muskogee High School.
Ownership History
Date
Name
Owned For
Owner Type
Purchase Details
Closed on
Nov 2, 2021
Sold by
Mortgage Clearing Corporation
Bought by
Lindstrom Jesse
Current Estimated Value
Home Financials for this Owner
Home Financials are based on the most recent Mortgage that was taken out on this home.
Original Mortgage
$24,978
Outstanding Balance
$4,852
Interest Rate
2.88%
Mortgage Type
Future Advance Clause Open End Mortgage
Estimated Equity
$85,064
Purchase Details
Closed on
Oct 27, 2021
Sold by
Mortgage Clearing Corporation and Edgmon Geneva M
Bought by
Edgmon Rex and Doe Jane
Home Financials for this Owner
Home Financials are based on the most recent Mortgage that was taken out on this home.
Original Mortgage
$24,978
Outstanding Balance
$4,852
Interest Rate
2.88%
Mortgage Type
Future Advance Clause Open End Mortgage
Estimated Equity
$85,064
Purchase Details
Closed on
Apr 15, 1999
Bought by
Edgmon Rex and Edgmon Geneva M
Purchase Details
Closed on
Feb 11, 1999
Purchase Details
Closed on
Mar 17, 1997
Create a Home Valuation Report for This Property
The Home Valuation Report is an in-depth analysis detailing your home's value as well as a comparison with similar homes in the area
Home Values in the Area
Average Home Value in this Area
Purchase History
| Date | Buyer | Sale Price | Title Company |
|---|---|---|---|
| Lindstrom Jesse | -- | None Listed On Document | |
| Edgmon Rex | -- | Livingston Rex | |
| Edgmon Rex | -- | Livingston Rex | |
| Edgmon Rex | $22,000 | -- | |
| -- | -- | -- | |
| -- | -- | -- |
Source: Public Records
Mortgage History
| Date | Status | Borrower | Loan Amount |
|---|---|---|---|
| Open | Lindstrom Jesse | $24,978 |
Source: Public Records
Tax History Compared to Growth
Tax History
| Year | Tax Paid | Tax Assessment Tax Assessment Total Assessment is a certain percentage of the fair market value that is determined by local assessors to be the total taxable value of land and additions on the property. | Land | Improvement |
|---|---|---|---|---|
| 2025 | $214 | $2,062 | $942 | $1,120 |
| 2024 | $214 | $1,963 | $901 | $1,062 |
| 2023 | $214 | $1,871 | $732 | $1,139 |
| 2022 | $186 | $1,871 | $732 | $1,139 |
| 2021 | $111 | $1,110 | $440 | $670 |
| 2020 | $111 | $1,110 | $440 | $670 |
| 2019 | $292 | $2,931 | $440 | $2,491 |
| 2018 | $286 | $2,931 | $440 | $2,491 |
| 2017 | $279 | $2,931 | $440 | $2,491 |
| 2016 | $279 | $2,931 | $440 | $2,491 |
| 2015 | $339 | $3,526 | $440 | $3,086 |
| 2014 | $1 | $3,526 | $440 | $3,086 |
Source: Public Records
Map
Nearby Homes
- 2116 Columbus Ave
- 2122 Denver St
- 2106 Denver St
- 1509 Columbus St
- 2402 Boston St
- 2314 Denver St
- 2425 Columbus St
- 109 N 16th St
- 0 Columbus Ave
- 2111 Elgin St
- 2419 W Okmulgee St
- 2601 Boston St
- 0 N 23rd St
- 1320 Boston St
- 2618 Columbus St
- 0 Court St
- 1420 W Broadway St
- 233 S 13th St
- 2118 Court St
- 2026 Court St
- 2026 Columbus St
- 2116 Columbus St
- 2024 Columbus St
- 2118 Columbus St
- 2027 Columbus St
- 2122 Columbus Ave
- 2022 Columbus St
- 2103 Columbus St
- 2120 Columbus St
- 2027 Boston St
- 2025 Boston St
- 2021 Boston St
- 2105 Boston St
- 2122 Columbus St
- 2017 Columbus St
- 2105 Columbus St
- 2111 Boston St
- 2017 Boston St
- 2107 Columbus St
- 2124 Columbus St