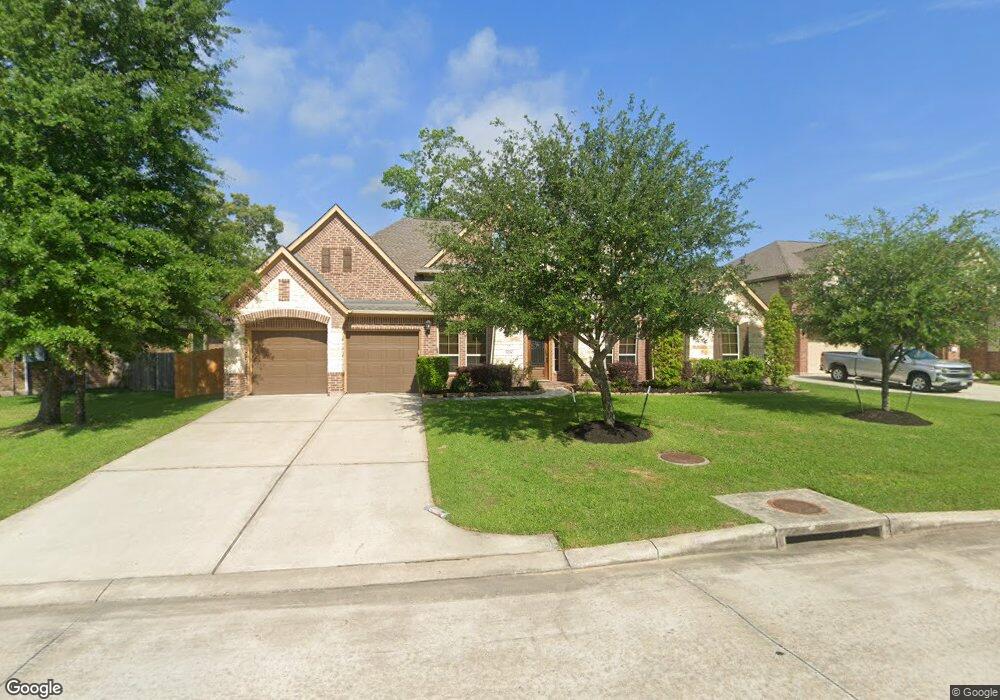
2028 Doolan Dr Conroe, TX 77301
Estimated Value: $416,154 - $458,000
4
Beds
3
Baths
2,873
Sq Ft
$150/Sq Ft
Est. Value
About This Home
This home is located at 2028 Doolan Dr, Conroe, TX 77301 and is currently estimated at $431,539, approximately $150 per square foot. 2028 Doolan Dr is a home located in Montgomery County with nearby schools including Wilkinson Elementary School, Stockton Junior High School, and Bozman Intermediate School.
Ownership History
Date
Name
Owned For
Owner Type
Purchase Details
Closed on
Nov 26, 2014
Sold by
Century Land Holdings Of Texas Llc
Bought by
Henderson Howard and Henderson Josefine
Current Estimated Value
Home Financials for this Owner
Home Financials are based on the most recent Mortgage that was taken out on this home.
Original Mortgage
$313,500
Outstanding Balance
$240,757
Interest Rate
3.99%
Mortgage Type
New Conventional
Estimated Equity
$190,782
Purchase Details
Closed on
Aug 14, 2014
Sold by
Grand View Builders Inc
Bought by
Henderson Howard and Henderson Josefine
Purchase Details
Closed on
May 8, 2014
Sold by
Amerigo Properties Ltd
Bought by
Grand View Builders Inc
Home Financials for this Owner
Home Financials are based on the most recent Mortgage that was taken out on this home.
Original Mortgage
$252,532
Interest Rate
4.43%
Mortgage Type
New Conventional
Create a Home Valuation Report for This Property
The Home Valuation Report is an in-depth analysis detailing your home's value as well as a comparison with similar homes in the area
Home Values in the Area
Average Home Value in this Area
Purchase History
| Date | Buyer | Sale Price | Title Company |
|---|---|---|---|
| Henderson Howard | -- | Platinum Title | |
| Henderson Howard | -- | -- | |
| Grand View Builders Inc | -- | None Available |
Source: Public Records
Mortgage History
| Date | Status | Borrower | Loan Amount |
|---|---|---|---|
| Open | Henderson Howard | $313,500 | |
| Previous Owner | Grand View Builders Inc | $252,532 |
Source: Public Records
Tax History
| Year | Tax Paid | Tax Assessment Tax Assessment Total Assessment is a certain percentage of the fair market value that is determined by local assessors to be the total taxable value of land and additions on the property. | Land | Improvement |
|---|---|---|---|---|
| 2025 | $11,468 | $440,592 | $95,113 | $345,479 |
| 2024 | $10,720 | $461,834 | $52,176 | $409,658 |
| 2023 | $10,720 | $431,170 | $52,180 | $378,990 |
| 2022 | $10,850 | $408,810 | $52,180 | $356,630 |
| 2021 | $8,457 | $303,510 | $52,180 | $251,330 |
| 2020 | $8,819 | $306,050 | $52,180 | $253,870 |
| 2019 | $9,199 | $313,770 | $32,400 | $281,370 |
| 2018 | $9,909 | $319,510 | $32,400 | $287,110 |
| 2017 | $9,918 | $337,220 | $32,400 | $304,820 |
| 2016 | $10,767 | $366,110 | $32,400 | $333,710 |
| 2015 | $355 | $313,050 | $32,400 | $280,650 |
| 2014 | $355 | $11,990 | $11,990 | $0 |
Source: Public Records
Map
Nearby Homes
- 2033 Brodie Ln
- 2051 Brodie Ln
- 2037 Borthwick Ln
- 2077 Brookmont Dr
- 967 Gowan Dr
- 2003 Doolan Dr
- 2007 Brookmont Dr
- 2016 Borthwick Ln
- 1024 Prescott Dr
- 1835 Pembrook Cir
- 1020 Prescott Dr
- 1526 Waggoner Ranch Ct
- 13247 Summer Rose Ln
- 1672 Hopson Ranch Dr
- 1668 Hopson Ranch Dr
- 1653 Hopson Ranch Dr
- 1652 Hopson Ranch Dr
- 1649 Hopson Ranch Dr
- 1000 Prescott Dr
- 1645 Hopson Ranch Dr
- 2030 Doolan Dr
- 2026 Doolan Dr
- 2029 Brodie Ln
- 2027 Brodie Ln
- 2032 Doolan Dr
- 2031 Doolan Dr
- 2031 Brodie Ln
- 2029 Doolan Dr
- 2027 Doolan Dr
- 2033 Doolan Dr
- 2034 Doolan Dr
- 2024 Doolan Dr
- 2025 Brodie Ln
- 2035 Doolan Dr
- 2025 Doolan Dr
- 2028 Brodie Ln
- 2040 Brookmont Dr
- 2037 Doolan Dr
- 2022 Doolan Dr
- 2026 Brodie Ln
Your Personal Tour Guide
Ask me questions while you tour the home.