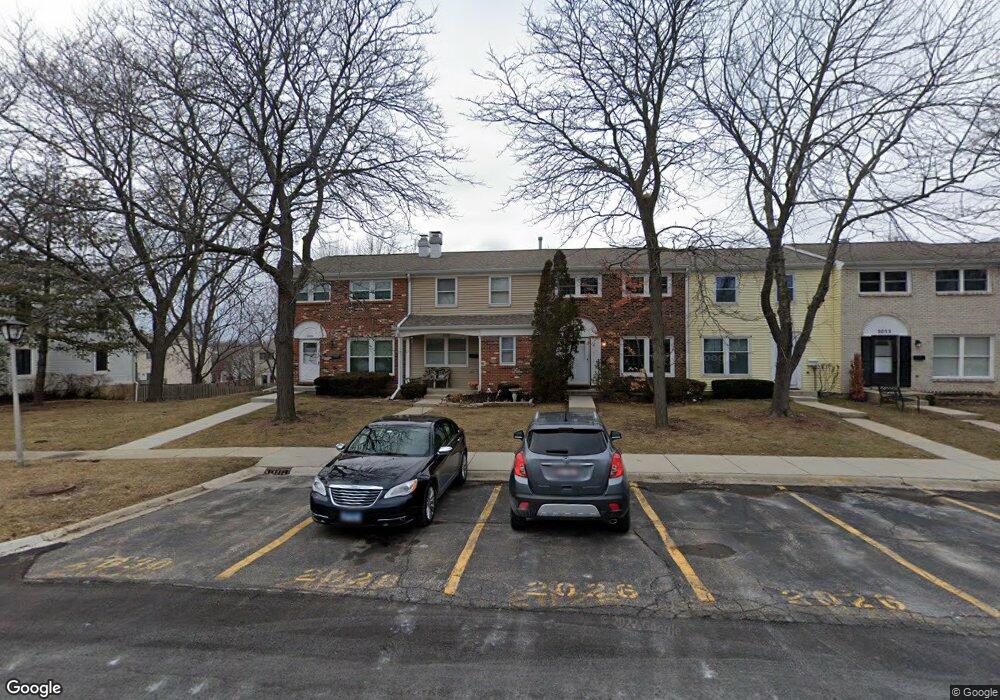
2028 Farnham Ct Unit 4 Schaumburg, IL 60194
West Schaumburg NeighborhoodEstimated Value: $295,000 - $317,000
3
Beds
2
Baths
1,338
Sq Ft
$225/Sq Ft
Est. Value
About This Home
This home is located at 2028 Farnham Ct Unit 4, Schaumburg, IL 60194 and is currently estimated at $301,514, approximately $225 per square foot. 2028 Farnham Ct Unit 4 is a home located in Cook County with nearby schools including Neil Armstrong Elementary School, Dwight D Eisenhower Junior High School, and Hoffman Estates High School.
Ownership History
Date
Name
Owned For
Owner Type
Purchase Details
Closed on
Nov 30, 1998
Sold by
Riesterer Richard F and Riesterer Louise M
Bought by
Thompson Edward M and Thompson Kathleen L
Current Estimated Value
Home Financials for this Owner
Home Financials are based on the most recent Mortgage that was taken out on this home.
Original Mortgage
$111,500
Outstanding Balance
$25,655
Interest Rate
6.93%
Estimated Equity
$275,859
Purchase Details
Closed on
Mar 28, 1995
Sold by
Lawson Glenn M and Lawson Michelle M
Bought by
Riesterer Richard F and Riesterer Louise M
Home Financials for this Owner
Home Financials are based on the most recent Mortgage that was taken out on this home.
Original Mortgage
$108,998
Interest Rate
8.64%
Mortgage Type
FHA
Create a Home Valuation Report for This Property
The Home Valuation Report is an in-depth analysis detailing your home's value as well as a comparison with similar homes in the area
Home Values in the Area
Average Home Value in this Area
Purchase History
| Date | Buyer | Sale Price | Title Company |
|---|---|---|---|
| Thompson Edward M | $115,000 | -- | |
| Riesterer Richard F | $110,000 | -- |
Source: Public Records
Mortgage History
| Date | Status | Borrower | Loan Amount |
|---|---|---|---|
| Open | Thompson Edward M | $111,500 | |
| Previous Owner | Riesterer Richard F | $108,998 |
Source: Public Records
Tax History Compared to Growth
Tax History
| Year | Tax Paid | Tax Assessment Tax Assessment Total Assessment is a certain percentage of the fair market value that is determined by local assessors to be the total taxable value of land and additions on the property. | Land | Improvement |
|---|---|---|---|---|
| 2024 | $3,918 | $20,000 | $3,500 | $16,500 |
| 2023 | $3,740 | $20,000 | $3,500 | $16,500 |
| 2022 | $3,740 | $20,000 | $3,500 | $16,500 |
| 2021 | $2,694 | $14,903 | $2,992 | $11,911 |
| 2020 | $3,512 | $14,903 | $2,992 | $11,911 |
| 2019 | $3,513 | $16,559 | $2,992 | $13,567 |
| 2018 | $4,060 | $16,982 | $2,612 | $14,370 |
| 2017 | $4,014 | $16,982 | $2,612 | $14,370 |
| 2016 | $3,993 | $16,982 | $2,612 | $14,370 |
| 2015 | $3,213 | $13,391 | $2,280 | $11,111 |
| 2014 | $3,193 | $13,391 | $2,280 | $11,111 |
| 2013 | $3,094 | $13,391 | $2,280 | $11,111 |
Source: Public Records
Map
Nearby Homes
- 923 Banbury Ct Unit 4
- 1912 Finchley Ct Unit 3
- 1929 Hastings Ct Unit 3
- 2216 Andover Ct
- 730 Hamilton Cir
- 752 N Brookdale Dr
- 845 Harmon Blvd
- 2342 Hamilton Place
- 775 Harmon Blvd
- 1975 Leiter Way Unit 12002
- 1988 Leiter Way Unit 13001
- 1981 Leiter Way Unit 12005
- 1977 Leiter Way Unit 12003
- 1986 Leiter Way Unit 13002
- 323 Green Knoll Ln Unit 1818
- 1711 Pebble Beach Ct
- 1375 Rebecca Dr Unit 213
- 1585 W Oakmont Rd
- 1941 Quaker Hollow Ln Unit 11
- 1968 Quaker Hollow Ln Unit 12
- 2026 Farnham Ct Unit 4
- 2030 Farnham Ct Unit 4
- 2024 Farnham Ct Unit 4
- 2016 Farnham Ct Unit 4
- 2022 Farnham Ct Unit 4
- 2020 Farnham Ct Unit 4
- 2018 Farnham Ct Unit 4
- 2034 Farnham Ct
- 2017 Stanley Ct Unit 4
- 2015 Stanley Ct Unit 4
- 2019 Stanley Ct Unit 4
- 2013 Stanley Ct Unit 4
- 2009 Stanley Ct Unit 4
- 2021 Stanley Ct
- 2036 Farnham Ct Unit 4
- 2011 Stanley Ct
- 2023 Stanley Ct Unit 4
- 2025 Stanley Ct Unit 4
- 2023 Farnham Ct Unit 4
- 2038 Farnham Ct