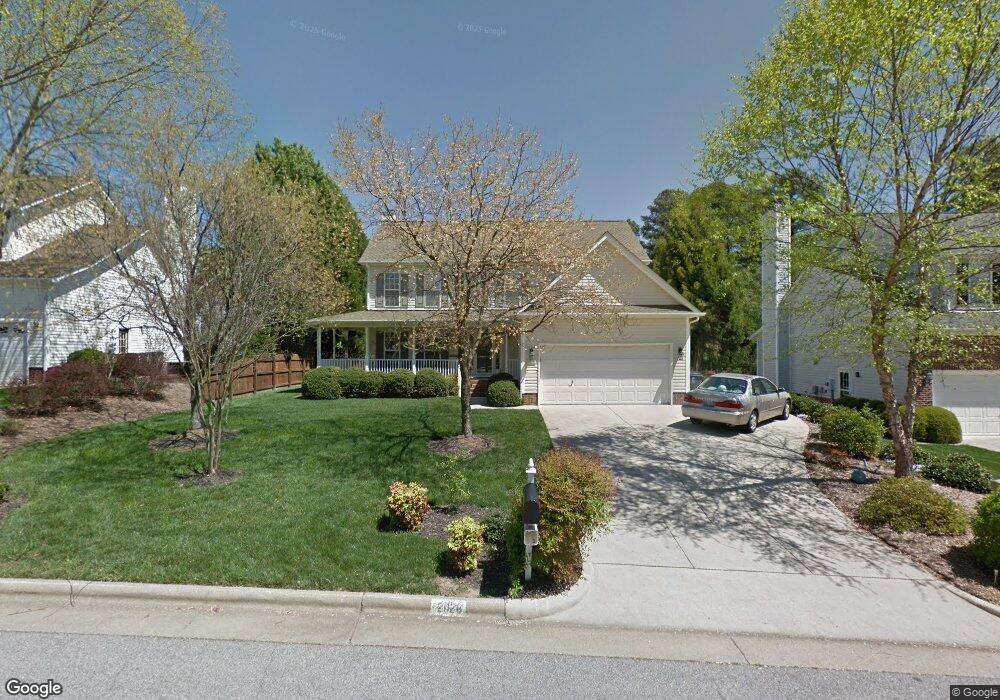
2028 Henniker St Apex, NC 27523
Beaver Creek NeighborhoodEstimated Value: $609,097 - $627,000
Studio
3
Baths
2,510
Sq Ft
$246/Sq Ft
Est. Value
About This Home
This home is located at 2028 Henniker St, Apex, NC 27523 and is currently estimated at $616,774, approximately $245 per square foot. 2028 Henniker St is a home located in Wake County with nearby schools including Turner Creek Elementary School, Salem Middle, and Green Level High School.
Ownership History
Date
Name
Owned For
Owner Type
Purchase Details
Closed on
Apr 26, 2017
Sold by
Williams Robert J and Williams Melanie S
Bought by
Demsko David and Demsko Olivia
Current Estimated Value
Home Financials for this Owner
Home Financials are based on the most recent Mortgage that was taken out on this home.
Original Mortgage
$305,402
Outstanding Balance
$248,730
Interest Rate
3.37%
Mortgage Type
FHA
Estimated Equity
$368,044
Purchase Details
Closed on
Dec 15, 1999
Sold by
Williams Melanie S and Arnott Carole C
Bought by
Williams Melanie S and Arnott Carole C
Purchase Details
Closed on
Sep 30, 1999
Sold by
Williams Robert J and Williams Melanie S
Bought by
Williams Melanie S and Arnott Carole C
Purchase Details
Closed on
May 21, 1997
Bought by
Williams Robert J and Williams Melanie S
Create a Home Valuation Report for This Property
The Home Valuation Report is an in-depth analysis detailing your home's value as well as a comparison with similar homes in the area
Home Values in the Area
Average Home Value in this Area
Purchase History
| Date | Buyer | Sale Price | Title Company |
|---|---|---|---|
| Demsko David | $320,000 | None Available | |
| Williams Melanie S | -- | -- | |
| Williams Melanie S | $94,000 | -- | |
| Williams Robert J | $190,000 | -- |
Source: Public Records
Mortgage History
| Date | Status | Borrower | Loan Amount |
|---|---|---|---|
| Open | Demsko David | $305,402 |
Source: Public Records
Tax History
| Year | Tax Paid | Tax Assessment Tax Assessment Total Assessment is a certain percentage of the fair market value that is determined by local assessors to be the total taxable value of land and additions on the property. | Land | Improvement |
|---|---|---|---|---|
| 2025 | $5,167 | $589,509 | $215,000 | $374,509 |
| 2024 | $5,051 | $589,509 | $215,000 | $374,509 |
Source: Public Records
Map
Nearby Homes
- 1805 Dunwick Ct
- 479 Clark Creek Ln
- 2300 Walden Creek Dr
- 305 Jeter Grove Rd
- 2013 Keokuk Ct
- 700 Oak Ridge Dr
- 793 Larkspur Bowl Way
- 2145 Grouse Ski Cir
- 2147 Grouse Ski Cir
- 2151 Grouse Ski Cir
- 7256 Morris Acres Rd
- 7242 Morris Acres Rd
- 831 Tunisian Dr
- 1808 Beaudet Ln
- 309 Amiable Loop
- 112 Del Rio Dr
- 2301 Blue Cedar Ct
- 424 Euphoria Cir
- 2513 Silas Peak Ln
- 105 Catchpenny Ct
- 2026 Henniker St
- 2030 Henniker St
- 2024 Henniker St
- 2029 Henniker St
- 2027 Henniker St
- 2031 Henniker St
- 2200 Dial Dr
- 2022 Henniker St
- 2025 Henniker St
- 2206 Dial Dr
- 2204 Dial Dr
- 2208 Dial Dr
- 2202 Dial Dr
- 2100 Henniker St
- 2004 Fitchburg Ct
- 2300 Speckled Alder Ct
- 2006 Fitchburg Ct
- 2101 Henniker St
- 2020 Henniker St
- 2002 Fitchburg Ct
Your Personal Tour Guide
Ask me questions while you tour the home.