Estimated Value: $72,179 - $147,000
--
Bed
1
Bath
1,104
Sq Ft
$109/Sq Ft
Est. Value
About This Home
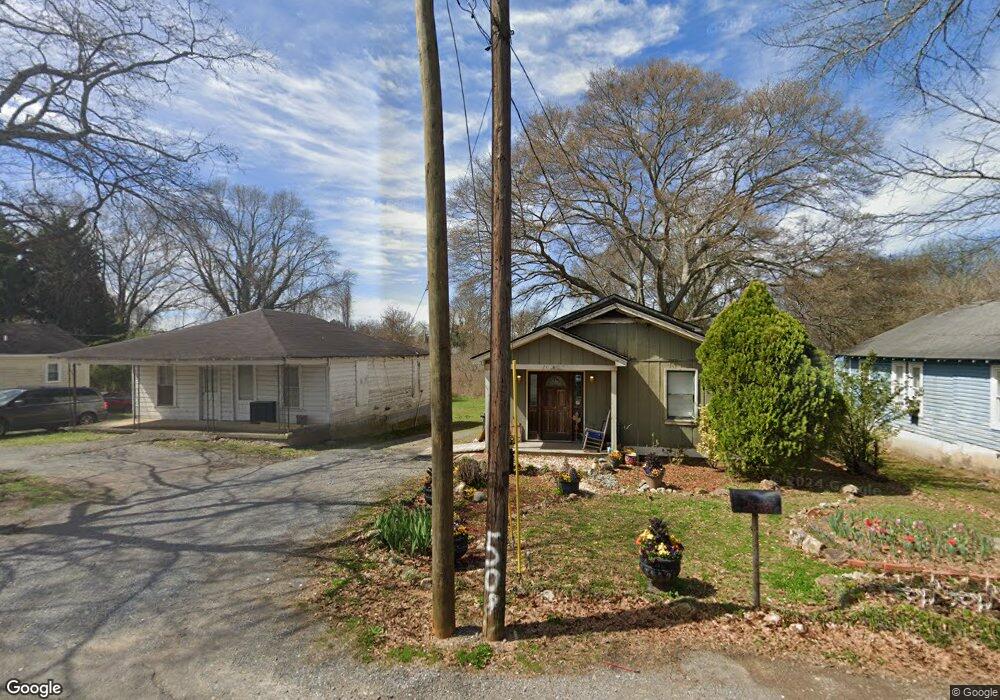
This home is located at 2028 Maple Ave SW, Rome, GA 30161 and is currently estimated at $119,795, approximately $108 per square foot. 2028 Maple Ave SW is a home located in Floyd County with nearby schools including Dan McCarty Middle School, Rome High School, and Darlington School.
Ownership History
Date
Name
Owned For
Owner Type
Purchase Details
Closed on
Mar 17, 2014
Sold by
Trotter George Pierce
Bought by
Trotter Lawanna
Current Estimated Value
Purchase Details
Closed on
Mar 10, 2014
Sold by
Trotter Lawanna
Bought by
Trotter George Pierce
Purchase Details
Closed on
Jan 22, 1998
Sold by
Trotter Novella
Bought by
Trotter George
Purchase Details
Closed on
Aug 20, 1990
Sold by
Bramlett Estelle
Bought by
Trotter Novella
Purchase Details
Closed on
Jul 5, 1943
Sold by
Bramlett C W Bramlett C W Bramlett C W
Bought by
Bramlett Estelle
Purchase Details
Closed on
Jan 1, 1901
Bought by
Bramlett C W Bramlett C W Bramlett
Create a Home Valuation Report for This Property
The Home Valuation Report is an in-depth analysis detailing your home's value as well as a comparison with similar homes in the area
Home Values in the Area
Average Home Value in this Area
Purchase History
| Date | Buyer | Sale Price | Title Company |
|---|---|---|---|
| Trotter Lawanna | -- | -- | |
| Trotter George Pierce | -- | -- | |
| Trotter George | -- | -- | |
| Trotter Novella | -- | -- | |
| Bramlett Estelle | -- | -- | |
| Bramlett C W Bramlett C W Bramlett | -- | -- |
Source: Public Records
Tax History Compared to Growth
Tax History
| Year | Tax Paid | Tax Assessment Tax Assessment Total Assessment is a certain percentage of the fair market value that is determined by local assessors to be the total taxable value of land and additions on the property. | Land | Improvement |
|---|---|---|---|---|
| 2024 | $393 | $23,176 | $4,400 | $18,776 |
| 2023 | $744 | $21,192 | $4,000 | $17,192 |
| 2022 | $628 | $17,211 | $3,200 | $14,011 |
| 2021 | $580 | $15,628 | $3,200 | $12,428 |
| 2020 | $528 | $14,121 | $2,500 | $11,621 |
| 2019 | $494 | $13,346 | $2,500 | $10,846 |
| 2018 | $460 | $12,423 | $2,500 | $9,923 |
| 2017 | $443 | $11,961 | $2,500 | $9,461 |
| 2016 | $432 | $11,644 | $2,480 | $9,164 |
| 2015 | -- | $11,644 | $2,480 | $9,164 |
| 2014 | -- | $11,644 | $2,480 | $9,164 |
Source: Public Records
Map
Nearby Homes
- 2014 Maple Ave SW
- 7 Willingham St SW
- 2108 Maple Ave SW
- 14 Clover St SW
- 304 E 19th St SW
- 111 Hosea St SW
- 1901 Hull Ave SW
- 1705 Olmstead St SW
- 0 Martha Berry Hwy Unit 7525627
- 0 Martha Berry Hwy Unit 7614774
- 0 Martha Berry Hwy Unit 10563404
- 000 E Oglethorpe Hwy
- 107 E Linden St SE
- 414 E 17th St SW
- 39 E 16th St SW
- 2501 Maple Rd SE
- 1502 Spring Creek St SW
- 2508 Maple Rd SE
- 4 E 15th St SW
- 106 E 14th St SW
- 2026 Maple Ave SW
- 2030 Maple Ave SW
- 2024 Maple Ave SW
- 2032 Maple Ave SW
- 2022 Maple Ave SW
- 2034 Maple Ave SW
- 2025 Maple Ave SW
- 2018 Maple Ave SW
- 2016 Maple Ave SW
- 2021 Maple Ave SW
- 2020 Maple Ave SW
- 2020 Maple Ave SW
- 2020 Maple Ave SW
- 2020 Maple Ave SW
- 3 Worsham St SW
- 2012 Maple Ave SW
- 5 Worsham St SW
- 3 Willingham St SW
- 4 Worsham St SW
- 2 Clover St SW