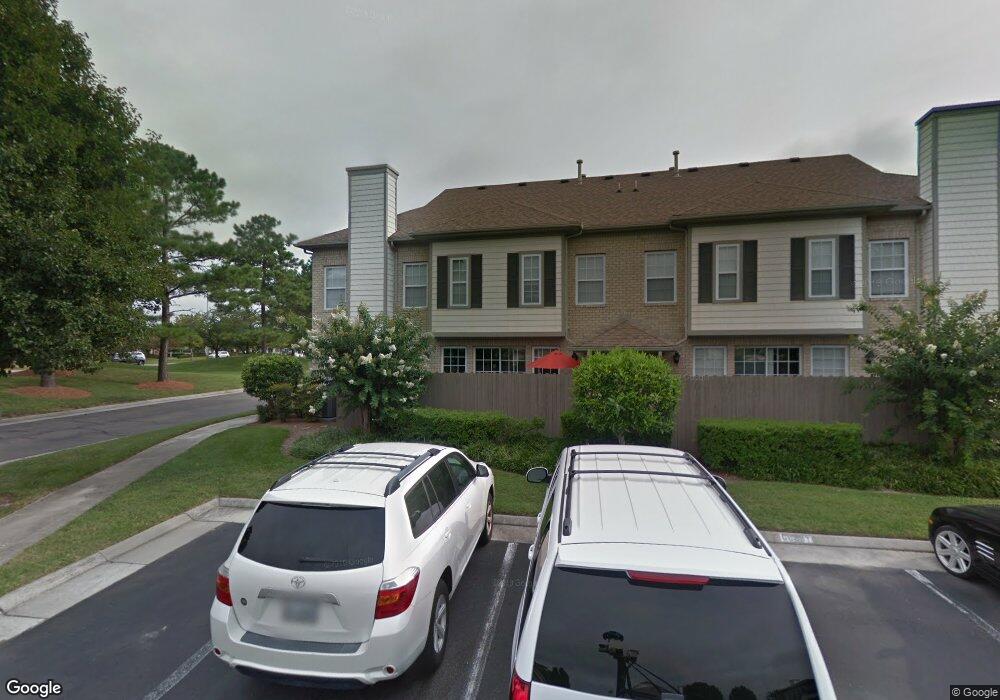
2028 Picardy Ct Virginia Beach, VA 23454
Virginia Beach Central NeighborhoodEstimated Value: $320,000 - $350,000
2
Beds
3
Baths
1,386
Sq Ft
$239/Sq Ft
Est. Value
About This Home
This home is located at 2028 Picardy Ct, Virginia Beach, VA 23454 and is currently estimated at $331,120, approximately $238 per square foot. 2028 Picardy Ct is a home located in Virginia Beach City with nearby schools including Red Mill Elementary School, Princess Anne Middle School, and Floyd E. Kellam High School.
Ownership History
Date
Name
Owned For
Owner Type
Purchase Details
Closed on
Aug 27, 2024
Sold by
Sullivan Thomas S and Sullivan Beverly H
Bought by
Sullivan Beverly H
Current Estimated Value
Purchase Details
Closed on
Sep 4, 2003
Sold by
Dragas Assocs Ix L C
Bought by
Sullivan Thomas S
Home Financials for this Owner
Home Financials are based on the most recent Mortgage that was taken out on this home.
Original Mortgage
$167,770
Interest Rate
6.02%
Mortgage Type
FHA
Create a Home Valuation Report for This Property
The Home Valuation Report is an in-depth analysis detailing your home's value as well as a comparison with similar homes in the area
Home Values in the Area
Average Home Value in this Area
Purchase History
| Date | Buyer | Sale Price | Title Company |
|---|---|---|---|
| Sullivan Beverly H | -- | None Listed On Document | |
| Sullivan Thomas S | $172,965 | -- |
Source: Public Records
Mortgage History
| Date | Status | Borrower | Loan Amount |
|---|---|---|---|
| Previous Owner | Sullivan Thomas S | $167,770 |
Source: Public Records
Tax History Compared to Growth
Tax History
| Year | Tax Paid | Tax Assessment Tax Assessment Total Assessment is a certain percentage of the fair market value that is determined by local assessors to be the total taxable value of land and additions on the property. | Land | Improvement |
|---|---|---|---|---|
| 2025 | $2,616 | $282,300 | $105,000 | $177,300 |
| 2024 | $2,616 | $269,700 | $105,000 | $164,700 |
| 2023 | $2,459 | $248,400 | $85,000 | $163,400 |
| 2022 | $2,178 | $220,000 | $75,000 | $145,000 |
| 2021 | $2,061 | $208,200 | $73,000 | $135,200 |
| 2020 | $1,971 | $193,700 | $73,000 | $120,700 |
| 2019 | $2,093 | $188,600 | $68,000 | $120,600 |
| 2018 | $1,891 | $188,600 | $68,000 | $120,600 |
| 2017 | $1,865 | $186,000 | $68,000 | $118,000 |
| 2016 | $1,750 | $176,800 | $64,500 | $112,300 |
| 2015 | $1,724 | $174,100 | $64,500 | $109,600 |
| 2014 | $1,713 | $184,200 | $80,600 | $103,600 |
Source: Public Records
Map
Nearby Homes
- 2504 Highfield Ct
- 2041 Hardwick Ct
- 2653 Level Loop Rd
- 2629 Level Loop Rd
- 2664 Elson Green Ave
- 1000 San Jose Ct
- 1097 Red Mill Blvd
- 1265 Warner Hall Dr
- 1213 Brookhill Ct
- 2100 Oaklawn Ct
- 2337 Treesong Trail
- 1306 Tuscany Dr
- 2325 Treesong Trail
- 2304 Treesong Trail
- 2321 Mathews Green Rd
- 2208 Brushwood Terrace
- 2153 Bierce Dr
- 2877 Weston Loop
- 2865 Weston Loop
- 2881 Weston Loop
- 2024 Picardy Ct
- 2296 Wessington Dr
- 2020 Picardy Ct
- 2276 Wessington Dr
- 2268 Wessington Dr
- 2272 Wessington Dr
- 2264 Wessington Dr
- 2008 Picardy Ct
- 2016 Picardy Ct
- 2004 Picardy Ct
- 2260 Wessington Dr
- 4740 Picardy Ct
- 2256 Wessington Dr
- 2000 Picardy Ct
- 2252 Wessington Dr
- 2248 Wessington Dr
- 2013 Picardy Ct
- 2009 Picardy Ct
- 2005 Picardy Ct
- 2273 Wessington Dr