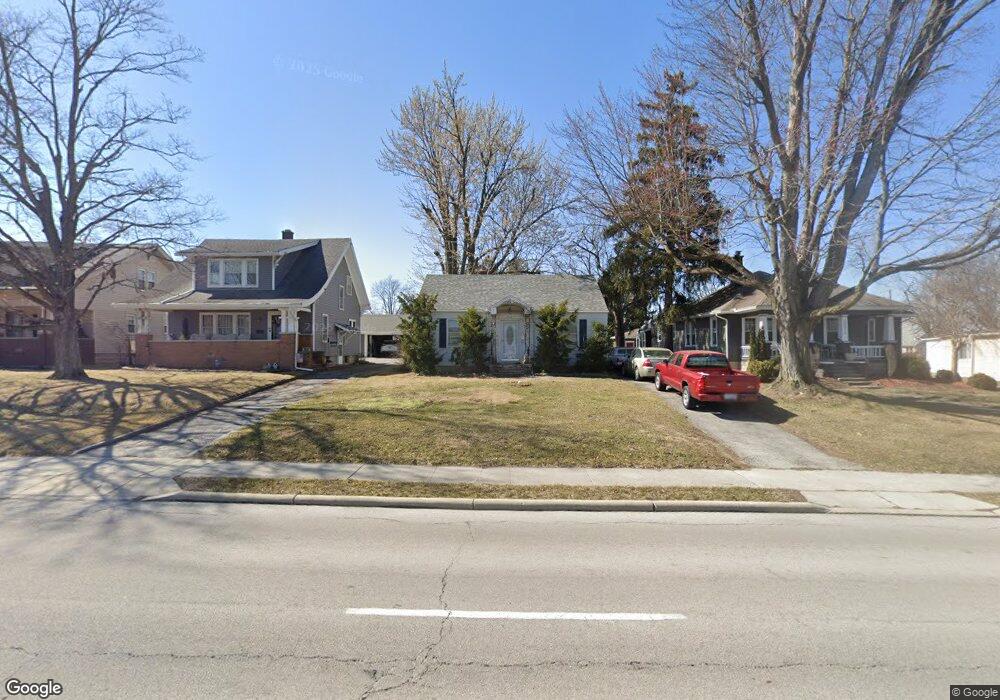
2028 S Main St Findlay, OH 45840
Estimated Value: $130,040 - $168,000
2
Beds
1
Bath
896
Sq Ft
$163/Sq Ft
Est. Value
About This Home
This home is located at 2028 S Main St, Findlay, OH 45840 and is currently estimated at $145,760, approximately $162 per square foot. 2028 S Main St is a home located in Hancock County with nearby schools including Jefferson Elementary School, Chamberlin Hill Elementary School, and Donnell Middle School.
Ownership History
Date
Name
Owned For
Owner Type
Purchase Details
Closed on
Nov 15, 2007
Sold by
Bish Sally D
Bought by
Mueksch Ernst H
Current Estimated Value
Home Financials for this Owner
Home Financials are based on the most recent Mortgage that was taken out on this home.
Original Mortgage
$83,341
Outstanding Balance
$52,975
Interest Rate
6.47%
Mortgage Type
FHA
Estimated Equity
$92,785
Purchase Details
Closed on
Jul 30, 2003
Sold by
Pinski John W and Pinski Erin L
Bought by
Bish Sally D
Home Financials for this Owner
Home Financials are based on the most recent Mortgage that was taken out on this home.
Original Mortgage
$82,000
Interest Rate
4.62%
Mortgage Type
Purchase Money Mortgage
Purchase Details
Closed on
Dec 14, 1993
Bought by
Pinski John W and Pinski Erin L
Purchase Details
Closed on
May 1, 1990
Bought by
Apple Jayme M
Purchase Details
Closed on
May 1, 1986
Bought by
Cole Phillip A and Cole Melinda J
Create a Home Valuation Report for This Property
The Home Valuation Report is an in-depth analysis detailing your home's value as well as a comparison with similar homes in the area
Home Values in the Area
Average Home Value in this Area
Purchase History
| Date | Buyer | Sale Price | Title Company |
|---|---|---|---|
| Mueksch Ernst H | $84,000 | Golden Key Title | |
| Bish Sally D | $82,000 | Mid Am | |
| Pinski John W | $63,500 | -- | |
| Apple Jayme M | $59,900 | -- | |
| Cole Phillip A | $42,000 | -- |
Source: Public Records
Mortgage History
| Date | Status | Borrower | Loan Amount |
|---|---|---|---|
| Open | Mueksch Ernst H | $83,341 | |
| Previous Owner | Bish Sally D | $82,000 |
Source: Public Records
Tax History Compared to Growth
Tax History
| Year | Tax Paid | Tax Assessment Tax Assessment Total Assessment is a certain percentage of the fair market value that is determined by local assessors to be the total taxable value of land and additions on the property. | Land | Improvement |
|---|---|---|---|---|
| 2024 | $779 | $31,730 | $6,140 | $25,590 |
| 2023 | $803 | $31,730 | $6,140 | $25,590 |
| 2022 | $815 | $31,730 | $6,140 | $25,590 |
| 2021 | $710 | $26,190 | $6,140 | $20,050 |
| 2020 | $710 | $26,190 | $6,140 | $20,050 |
| 2019 | $696 | $26,190 | $6,140 | $20,050 |
| 2018 | $617 | $22,890 | $5,340 | $17,550 |
| 2017 | $308 | $22,890 | $5,340 | $17,550 |
| 2016 | $620 | $22,890 | $5,340 | $17,550 |
| 2015 | $358 | $16,940 | $4,980 | $11,960 |
| 2014 | $358 | $16,940 | $4,980 | $11,960 |
| 2012 | $364 | $16,940 | $4,980 | $11,960 |
Source: Public Records
Map
Nearby Homes
- 200 E Edgar Ave
- 1705 S Main St
- 211 Fairlawn Place
- 1621 S Main St
- 164 Church Hill Dr
- 1727 Washington Ave
- 500 Blue Bonnet Dr
- 1421 Hurd Ave
- 325 Greenlawn Ave
- 123 Glendale Ave
- 1211 S Main St
- 401 Bittersweet Dr
- 424 3rd St
- 1119 Washington Ave
- 804 6th St
- 1818 Westview Dr
- 1115 Liberty St
- 1109 Park St
- 1006 Washington Ave
- 0 Viburnum Ct Unit 6121366
- 2032 S Main St
- 2024 S Main St
- 2036 S Main St
- 2020 S Main St
- 116 W Hobart Ave
- 2010 S Main St
- 2108 S Main St
- 2004 S Main St
- 122 W Hobart Ave
- 113 W Hobart Ave
- 2000 S Main St
- 2035 S Main St
- 2021 S Main St
- 2120 S Main St
- 117 W Hobart Ave
- 126 W Hobart Ave
- 2015 S Main St
- 31 E Eagle St
- 2005 S Main St
- 2101 S Main St