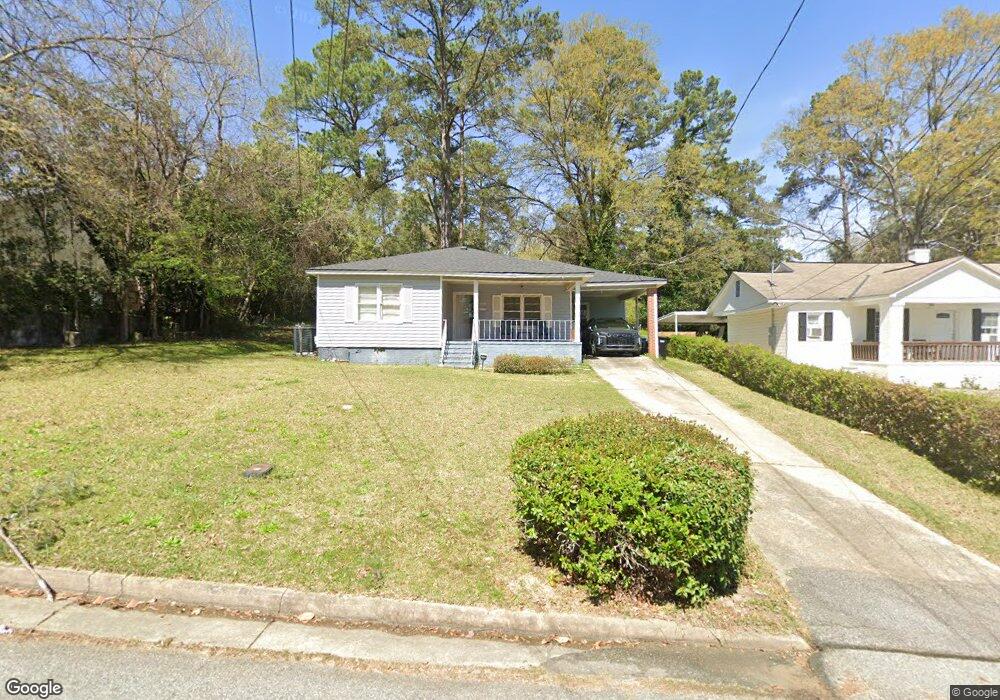
2029 41st St Columbus, GA 31904
North Columbus NeighborhoodEstimated Value: $105,000 - $156,054
2
Beds
2
Baths
1,951
Sq Ft
$66/Sq Ft
Est. Value
About This Home
This home is located at 2029 41st St, Columbus, GA 31904 and is currently estimated at $129,014, approximately $66 per square foot. 2029 41st St is a home located in Muscogee County with nearby schools including Johnson Elementary School, Richards Middle School, and Jordan Vocational High School.
Ownership History
Date
Name
Owned For
Owner Type
Purchase Details
Closed on
Sep 30, 2021
Sold by
Ahmed Mallik R
Bought by
Shoma & Riton Llc
Current Estimated Value
Purchase Details
Closed on
Apr 11, 2016
Sold by
Ahmed Mallik R
Bought by
Ahmed Mallik R and Ahmed Fatema Sultana
Purchase Details
Closed on
Oct 15, 2015
Sold by
Wells Fargo Bank
Bought by
Sec Of Veterans Affairs
Purchase Details
Closed on
Oct 6, 2015
Sold by
Brown Gregory L
Bought by
Wells Fargo Bank
Create a Home Valuation Report for This Property
The Home Valuation Report is an in-depth analysis detailing your home's value as well as a comparison with similar homes in the area
Home Values in the Area
Average Home Value in this Area
Purchase History
| Date | Buyer | Sale Price | Title Company |
|---|---|---|---|
| Shoma & Riton Llc | -- | -- | |
| Ahmed Mallik R | $25,600 | -- | |
| Ahmed Mallik R | $25,600 | -- | |
| Sec Of Veterans Affairs | $42,525 | -- | |
| Wells Fargo Bank | $42,525 | -- |
Source: Public Records
Tax History
| Year | Tax Paid | Tax Assessment Tax Assessment Total Assessment is a certain percentage of the fair market value that is determined by local assessors to be the total taxable value of land and additions on the property. | Land | Improvement |
|---|---|---|---|---|
| 2025 | $1,725 | $44,076 | $8,180 | $35,896 |
| 2024 | $1,725 | $44,076 | $8,180 | $35,896 |
| 2023 | $174 | $44,076 | $8,180 | $35,896 |
| 2022 | $1,443 | $35,344 | $8,180 | $27,164 |
| 2021 | $1,344 | $32,916 | $8,180 | $24,736 |
| 2020 | $1,344 | $32,916 | $8,180 | $24,736 |
| 2019 | $1,349 | $32,916 | $8,180 | $24,736 |
| 2018 | $1,349 | $32,916 | $8,180 | $24,736 |
| 2017 | $421 | $10,240 | $2,680 | $7,560 |
| 2016 | $1,274 | $30,890 | $3,520 | $27,370 |
| 2015 | $728 | $30,890 | $3,520 | $27,370 |
| 2014 | $730 | $30,890 | $3,520 | $27,370 |
| 2013 | -- | $30,890 | $3,520 | $27,370 |
Source: Public Records
Map
Nearby Homes
- 2110 Terrace Dr
- 4214 17th Ave
- 3905 Crestview Dr
- 4526 19th Ave
- 4001 17th Ave
- 3640 Calvin Dr
- 4310 Acacia Dr
- 3600 23rd Ave
- 2329 Devonshire Dr
- 4814 20th Ave
- 2322 Winchester Dr
- 4212 Chalfonte Dr
- 2345 Gurley Dr
- 2369 Gurley Dr
- 4303 Armour Rd
- 4830 17th Ave
- 1801 34th St
- 2515 Camille Dr
- 3425 17th Ave
- 1722 34th St
Your Personal Tour Guide
Ask me questions while you tour the home.