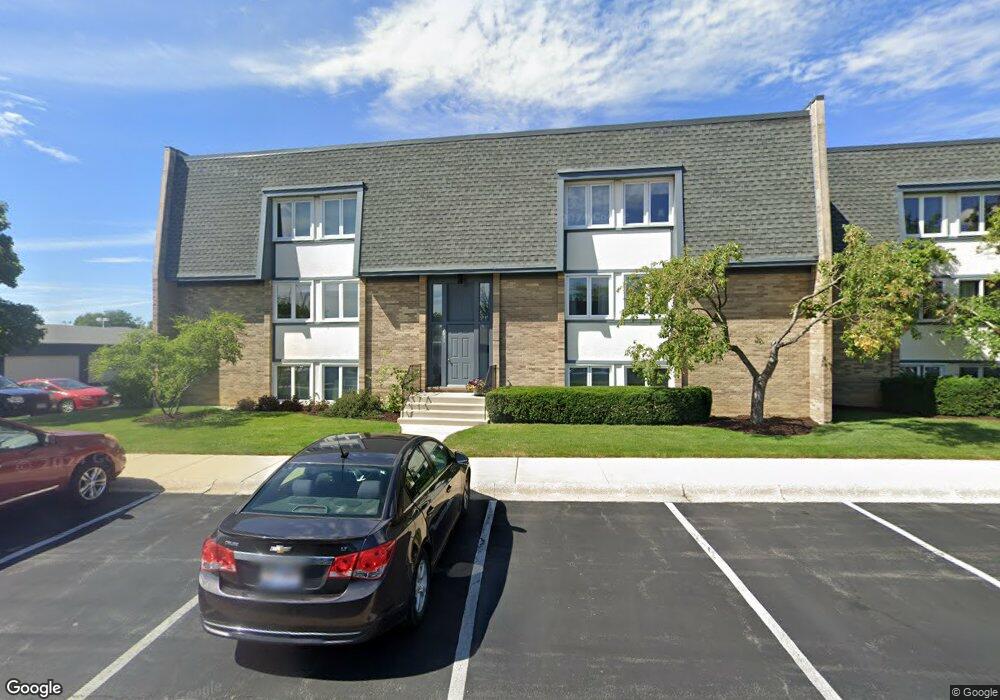
2029 Ammer Ridge Ct Unit 1820 Glenview, IL 60025
Estimated Value: $353,017 - $365,000
2
Beds
2
Baths
1,133
Sq Ft
$315/Sq Ft
Est. Value
About This Home
This home is located at 2029 Ammer Ridge Ct Unit 1820, Glenview, IL 60025 and is currently estimated at $356,504, approximately $314 per square foot. 2029 Ammer Ridge Ct Unit 1820 is a home located in Cook County with nearby schools including Lyon Elementary School, Pleasant Ridge Elementary School, and Attea Middle School.
Ownership History
Date
Name
Owned For
Owner Type
Purchase Details
Closed on
Jan 10, 2017
Sold by
Mckenzie Charle and Mckenzie Lynn
Bought by
King Robert C and King Suja K
Current Estimated Value
Home Financials for this Owner
Home Financials are based on the most recent Mortgage that was taken out on this home.
Original Mortgage
$176,250
Outstanding Balance
$146,795
Interest Rate
4.5%
Mortgage Type
New Conventional
Estimated Equity
$209,709
Purchase Details
Closed on
Jun 5, 2015
Sold by
Fortofoi Florin and Fortofoi Radoslav Alina
Bought by
Mckenzie Lynn and Mckenzie Charles
Purchase Details
Closed on
Sep 4, 2007
Sold by
Seneco Lillian E
Bought by
Fortofoi Florin and Fortofoi Radoslav Alina
Home Financials for this Owner
Home Financials are based on the most recent Mortgage that was taken out on this home.
Original Mortgage
$208,800
Interest Rate
6.72%
Mortgage Type
Unknown
Purchase Details
Closed on
Aug 2, 2006
Sold by
Seneco Lillian E
Bought by
Seneco Lillian E and The Lillian E Seneco Trust
Create a Home Valuation Report for This Property
The Home Valuation Report is an in-depth analysis detailing your home's value as well as a comparison with similar homes in the area
Home Values in the Area
Average Home Value in this Area
Purchase History
| Date | Buyer | Sale Price | Title Company |
|---|---|---|---|
| King Robert C | $235,000 | Chicago Title | |
| Mckenzie Lynn | $235,000 | Ct | |
| Fortofoi Florin | $232,000 | Fort Dearborn Land Title | |
| Seneco Lillian E | -- | None Available |
Source: Public Records
Mortgage History
| Date | Status | Borrower | Loan Amount |
|---|---|---|---|
| Open | King Robert C | $176,250 | |
| Previous Owner | Fortofoi Florin | $208,800 |
Source: Public Records
Tax History Compared to Growth
Tax History
| Year | Tax Paid | Tax Assessment Tax Assessment Total Assessment is a certain percentage of the fair market value that is determined by local assessors to be the total taxable value of land and additions on the property. | Land | Improvement |
|---|---|---|---|---|
| 2024 | $5,432 | $24,542 | $3,552 | $20,990 |
| 2023 | $5,279 | $24,542 | $3,552 | $20,990 |
| 2022 | $5,279 | $24,542 | $3,552 | $20,990 |
| 2021 | $5,122 | $20,577 | $3,641 | $16,936 |
| 2020 | $5,061 | $20,577 | $3,641 | $16,936 |
| 2019 | $4,730 | $22,677 | $3,641 | $19,036 |
| 2018 | $3,860 | $16,783 | $3,197 | $13,586 |
| 2017 | $3,001 | $16,783 | $3,197 | $13,586 |
| 2016 | $3,022 | $16,783 | $3,197 | $13,586 |
| 2015 | $2,692 | $13,928 | $2,752 | $11,176 |
| 2014 | $2,656 | $13,928 | $2,752 | $11,176 |
| 2013 | $2,561 | $13,928 | $2,752 | $11,176 |
Source: Public Records
Map
Nearby Homes
- 2101 Valley lo Ln
- 1410 Tuscany Ct
- 1740 Melise Dr
- 1743 Melise Dr
- 1719 Wildberry Dr Unit B
- 1855 Tanglewood Dr Unit F
- 1847 Tanglewood Dr Unit 3B
- 1847 Tanglewood Dr Unit 2B
- 431 4th St
- 804 8th St
- 2000 Chestnut Ave Unit 103
- 1508 Pebblecreek Dr Unit 14
- 1553 Hawthorne Ln
- 1429 Pebblecreek Dr Unit 171
- 1050 Burton Terrace
- 2700 Summit Dr Unit 101
- 1838 Aberdeen Dr
- 1342 Pine St
- 118 Dickens Rd
- 1341 Greenwillow Ln Unit C
- 2029 Ammer Ridge Ct Unit 1820
- 2029 Ammer Ridge Ct Unit 1810
- 2029 Ammer Ridge Ct Unit 1810
- 2029 Ammer Ridge Ct Unit 1830
- 2029 Ammer Ridge Ct Unit 1830
- 2029 Ammer Ridge Ct Unit 202
- 2029 Ammer Ridge Ct Unit 201
- 2029 Ammer Ridge Ct Unit 301
- 2031 Ammer Ridge Ct Unit 1710
- 2031 Ammer Ridge Ct Unit 1730
- 2031 Ammer Ridge Ct Unit 1720
- 2031 Ammer Ridge Ct Unit 1720
- 2031 Ammer Ridge Ct Unit 1730
- 2031 Ammer Ridge Ct Unit 202
- 2031 Ammer Ridge Ct Unit 302
- 2031 Ammer Ridge Ct Unit 101
- 2031 Ammer Ridge Ct Unit 102
- 2025 Ammer Ridge Ct Unit 1920
- 2025 Ammer Ridge Ct Unit 1920
- 2025 Ammer Ridge Ct Unit 1910