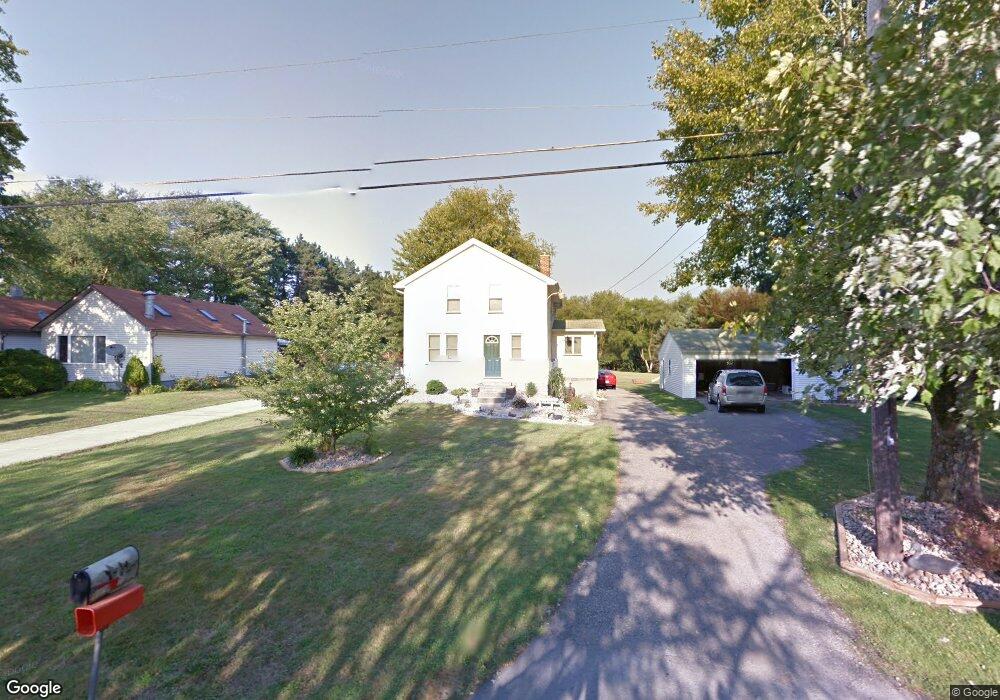
2029 Beatty Rd Hubbard, OH 44425
Estimated Value: $129,000 - $172,989
3
Beds
1
Bath
1,780
Sq Ft
$85/Sq Ft
Est. Value
About This Home
This home is located at 2029 Beatty Rd, Hubbard, OH 44425 and is currently estimated at $151,497, approximately $85 per square foot. 2029 Beatty Rd is a home located in Trumbull County with nearby schools including Hubbard Elementary School, Hubbard Middle School, and Hubbard High School.
Ownership History
Date
Name
Owned For
Owner Type
Purchase Details
Closed on
May 31, 2002
Sold by
Humphries Robert A and Humphries Annette E
Bought by
Tingler Edward B and Tingler Dawnrae E
Current Estimated Value
Home Financials for this Owner
Home Financials are based on the most recent Mortgage that was taken out on this home.
Original Mortgage
$42,000
Outstanding Balance
$17,997
Interest Rate
7%
Mortgage Type
New Conventional
Estimated Equity
$133,500
Purchase Details
Closed on
Jan 1, 1990
Sold by
Robert Robert A A and Robert Annette E
Bought by
Robert A Humphries and Robert Annette E
Create a Home Valuation Report for This Property
The Home Valuation Report is an in-depth analysis detailing your home's value as well as a comparison with similar homes in the area
Home Values in the Area
Average Home Value in this Area
Purchase History
| Date | Buyer | Sale Price | Title Company |
|---|---|---|---|
| Tingler Edward B | $57,000 | -- | |
| Robert A Humphries | -- | -- |
Source: Public Records
Mortgage History
| Date | Status | Borrower | Loan Amount |
|---|---|---|---|
| Open | Tingler Edward B | $42,000 |
Source: Public Records
Tax History Compared to Growth
Tax History
| Year | Tax Paid | Tax Assessment Tax Assessment Total Assessment is a certain percentage of the fair market value that is determined by local assessors to be the total taxable value of land and additions on the property. | Land | Improvement |
|---|---|---|---|---|
| 2024 | $2,419 | $42,670 | $5,390 | $37,280 |
| 2023 | $2,419 | $42,670 | $5,390 | $37,280 |
| 2022 | $2,068 | $32,520 | $4,940 | $27,580 |
| 2021 | $2,077 | $32,520 | $4,940 | $27,580 |
| 2020 | $2,085 | $32,520 | $4,940 | $27,580 |
| 2019 | $1,934 | $28,570 | $4,590 | $23,980 |
| 2018 | $1,876 | $28,570 | $4,590 | $23,980 |
| 2017 | $1,871 | $28,570 | $4,590 | $23,980 |
| 2016 | $1,816 | $29,090 | $4,590 | $24,500 |
| 2015 | $1,822 | $29,090 | $4,590 | $24,500 |
| 2014 | $1,787 | $29,090 | $4,590 | $24,500 |
| 2013 | $1,784 | $29,090 | $4,590 | $24,500 |
Source: Public Records
Map
Nearby Homes
- 1952 Hubbard Masury Rd
- 1911 Hubbard Thomas Rd
- 7111 Pine Grove Dr
- 7847 Chestnut St
- 1354 Stevenson Rd
- 7737 Elm St
- 7822 2nd St
- 784 Elmwood Dr
- 462 Elizabeth St
- 11 Clubhouse Dr
- 1017 Broadway St
- 611 Moore St
- 395 Elizabeth St
- 1 Grandview Dr
- 764 Jones St
- 132 Drummond Ave
- 138 Moore St
- 430 E Park Ave
- 104 Fruit Ave
- 506 Spearman Ave
- 2019 Beatty Rd
- 2045 Beatty Rd
- 2011 Beatty Rd
- 2003 Beatty Rd
- 2055 Beatty Rd
- 2010 Beatty Rd
- 1997 Beatty Rd
- 1998 Beatty Rd
- 1988 Beatty Rd
- 1943 Beatty Rd
- 1974 Beatty Rd
- 1961 Beatty Rd
- 1986 Hubbard Masury Rd
- 1974 Hubbard Masury Rd
- 1964 Hubbard Masury Rd
- 1992 Hubbard Masury Rd
- 1944 Hubbard Masury Rd
- 1934 Hubbard Masury Rd
- 2311 N Fox Rd N
- 2070 Hubbard Masury Rd