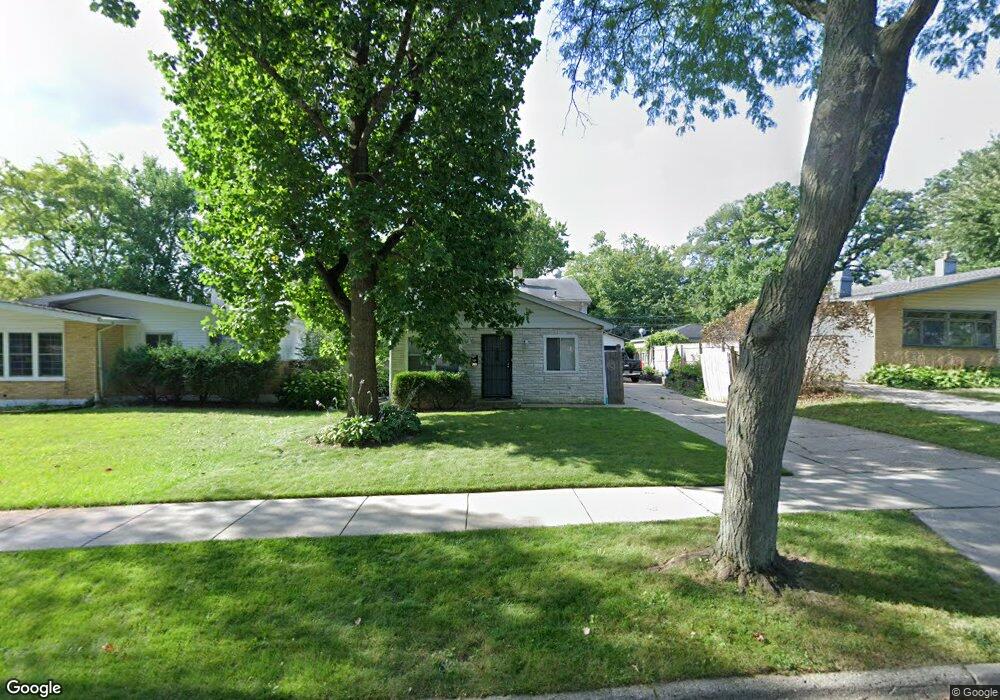
2029 Devonshire Rd Waukegan, IL 60087
Estimated Value: $240,000 - $282,000
3
Beds
2
Baths
1,008
Sq Ft
$262/Sq Ft
Est. Value
About This Home
This home is located at 2029 Devonshire Rd, Waukegan, IL 60087 and is currently estimated at $263,981, approximately $261 per square foot. 2029 Devonshire Rd is a home located in Lake County with nearby schools including H R McCall Elementary School, Jack Benny Middle School, and Waukegan High School.
Ownership History
Date
Name
Owned For
Owner Type
Purchase Details
Closed on
Sep 9, 2016
Sold by
Bashore Nicklas R and Bashore Fernanda L
Bought by
Rodriguez M Isidra and Aguirre Carlos Rodriguez
Current Estimated Value
Home Financials for this Owner
Home Financials are based on the most recent Mortgage that was taken out on this home.
Original Mortgage
$154,156
Outstanding Balance
$123,410
Interest Rate
3.5%
Mortgage Type
FHA
Estimated Equity
$140,571
Purchase Details
Closed on
Nov 18, 2005
Sold by
Garrett Alford S
Bought by
Bashore Nicklas R and Bashore Fernanda L
Home Financials for this Owner
Home Financials are based on the most recent Mortgage that was taken out on this home.
Original Mortgage
$165,000
Interest Rate
6.34%
Mortgage Type
Fannie Mae Freddie Mac
Create a Home Valuation Report for This Property
The Home Valuation Report is an in-depth analysis detailing your home's value as well as a comparison with similar homes in the area
Purchase History
| Date | Buyer | Sale Price | Title Company |
|---|---|---|---|
| Rodriguez M Isidra | $157,000 | First American Title | |
| Bashore Nicklas R | $165,000 | First American Title |
Source: Public Records
Mortgage History
| Date | Status | Borrower | Loan Amount |
|---|---|---|---|
| Open | Rodriguez M Isidra | $154,156 | |
| Previous Owner | Bashore Nicklas R | $165,000 |
Source: Public Records
Tax History
| Year | Tax Paid | Tax Assessment Tax Assessment Total Assessment is a certain percentage of the fair market value that is determined by local assessors to be the total taxable value of land and additions on the property. | Land | Improvement |
|---|---|---|---|---|
| 2024 | $5,948 | $78,105 | $10,054 | $68,051 |
| 2023 | $5,492 | $71,078 | $9,083 | $61,995 |
| 2022 | $5,492 | $62,180 | $7,789 | $54,391 |
| 2021 | $5,318 | $57,006 | $7,417 | $49,589 |
| 2020 | $5,340 | $53,108 | $6,910 | $46,198 |
| 2019 | $5,325 | $48,665 | $6,332 | $42,333 |
| 2018 | $4,470 | $40,933 | $8,148 | $32,785 |
| 2017 | $4,301 | $36,215 | $7,209 | $29,006 |
| 2016 | $3,653 | $29,617 | $6,264 | $23,353 |
| 2015 | $3,464 | $26,507 | $5,606 | $20,901 |
| 2014 | $2,890 | $23,067 | $5,519 | $17,548 |
| 2012 | $3,895 | $24,991 | $5,980 | $19,011 |
Source: Public Records
Map
Nearby Homes
- 2936 Witchwood Ln
- 1507 W York House Rd
- 3101 Country Club Ln
- 1730 W Beach Rd
- 2820 N Elmwood Ave
- 1403 W Beach Rd
- 2805 N Elmwood Ave
- 38169 N North Shore Ave
- 38132 N Manor Ave
- 11471 W Leland Ave
- 38633 N Cedar Ave
- 38119 N Wilson Ave
- 2629 N Mcaree Rd
- 3805 Bertrand Ln
- 1136 10 Pin Ln
- 2605 N Pine St
- 11342-11364 W Wadsworth Rd
- 12346 W Sallmon Ave
- 2705 Jacquelyn Ln
- 12707 W Warner St
- 2025 Devonshire Rd
- 2033 Devonshire Rd
- 2021 Devonshire Rd
- 2037 Devonshire Rd
- 3313 Newcastle Rd Unit 1
- 3308 Rugby Ct
- 3304 Rugby Ct
- 3309 Newcastle Rd
- 2017 Devonshire Rd
- 2028 Devonshire Rd
- 2024 Devonshire Rd
- 2032 Devonshire Rd Unit 1
- 2020 Devonshire Rd
- 2036 Devonshire Rd
- 3305 Newcastle Rd
- 3309 Rugby Ct
- 2013 Devonshire Rd
- 3316 Newcastle Rd Unit 1
- 2016 Devonshire Rd Unit 1
- 3301 Newcastle Rd
Your Personal Tour Guide
Ask me questions while you tour the home.