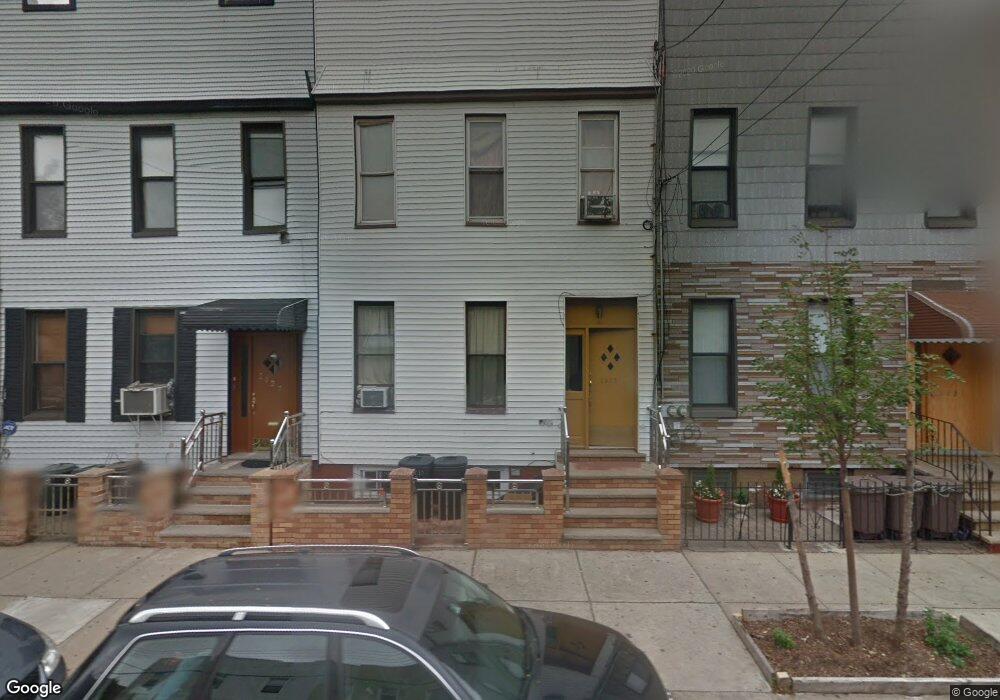
2029 Greene Ave Ridgewood, NY 11385
Ridgewood NeighborhoodEstimated Value: $903,384 - $1,224,000
--
Bed
--
Bath
2,100
Sq Ft
$526/Sq Ft
Est. Value
About This Home
This home is located at 2029 Greene Ave, Ridgewood, NY 11385 and is currently estimated at $1,104,346, approximately $525 per square foot. 2029 Greene Ave is a home located in Queens County with nearby schools including P.S. 71 Forest, I.S. 093 Ridgewood, and Grover Cleveland High School.
Ownership History
Date
Name
Owned For
Owner Type
Purchase Details
Closed on
Apr 18, 2014
Sold by
Almonte Rafael A and Rodriguez Johansen
Bought by
Rodriguez Johansen and Rodriguez Julia
Current Estimated Value
Home Financials for this Owner
Home Financials are based on the most recent Mortgage that was taken out on this home.
Original Mortgage
$381,500
Outstanding Balance
$289,793
Interest Rate
4.32%
Mortgage Type
New Conventional
Estimated Equity
$814,553
Purchase Details
Closed on
Dec 7, 2012
Sold by
Almonte Rafael A and Orosco Julia M
Bought by
Almonte Rafael A and Rodriguez Johansen
Purchase Details
Closed on
Mar 9, 1999
Sold by
Nagle Douglas and Depperman Joseph H
Bought by
Orozco Julia M and Almonte Rafael
Home Financials for this Owner
Home Financials are based on the most recent Mortgage that was taken out on this home.
Original Mortgage
$187,904
Interest Rate
6.83%
Mortgage Type
FHA
Create a Home Valuation Report for This Property
The Home Valuation Report is an in-depth analysis detailing your home's value as well as a comparison with similar homes in the area
Home Values in the Area
Average Home Value in this Area
Purchase History
| Date | Buyer | Sale Price | Title Company |
|---|---|---|---|
| Rodriguez Johansen | -- | -- | |
| Almonte Rafael A | -- | -- | |
| Orozco Julia M | $188,000 | -- |
Source: Public Records
Mortgage History
| Date | Status | Borrower | Loan Amount |
|---|---|---|---|
| Open | Rodriguez Johansen | $381,500 | |
| Previous Owner | Orozco Julia M | $187,904 |
Source: Public Records
Tax History Compared to Growth
Tax History
| Year | Tax Paid | Tax Assessment Tax Assessment Total Assessment is a certain percentage of the fair market value that is determined by local assessors to be the total taxable value of land and additions on the property. | Land | Improvement |
|---|---|---|---|---|
| 2025 | $5,872 | $30,954 | $6,098 | $24,856 |
| 2024 | $5,872 | $29,237 | $5,410 | $23,827 |
| 2023 | $5,613 | $27,946 | $5,404 | $22,542 |
| 2022 | $5,321 | $58,920 | $11,880 | $47,040 |
| 2021 | $5,610 | $57,840 | $11,880 | $45,960 |
| 2020 | $5,460 | $50,340 | $11,880 | $38,460 |
| 2019 | $5,097 | $55,440 | $11,880 | $43,560 |
| 2018 | $4,747 | $23,288 | $5,023 | $18,265 |
| 2017 | $4,228 | $22,213 | $5,704 | $16,509 |
| 2016 | $4,131 | $22,213 | $5,704 | $16,509 |
| 2015 | $2,527 | $21,496 | $9,534 | $11,962 |
| 2014 | $2,527 | $20,304 | $7,662 | $12,642 |
Source: Public Records
Map
Nearby Homes
- 2027 Bleecker St
- 20-35 Menahan St
- 20-22 Menahan St
- 2135 Menahan St
- 63-16 Forest Ave Unit 1B
- 1904 Harman St Unit 1 B
- 1904 Harman St Unit 3 B
- 1904 Harman St Unit 3 A
- 59-46 Linden St
- 1916 Himrod St
- 19-16 Himrod St
- 6315 Forest Ave Unit 1A
- 1879 Grove St
- 5932 Grove St
- 5929 Linden St
- 62-60 60th St
- 508 Onderdonk Ave
- 6018 Bleecker St
- 1823 Bleecker St
- 586 Onderdonk Ave
- 2027 Greene Ave
- 2031 Greene Ave
- 20-31 Greene Ave
- 2031 Greene Ave
- 2033 Greene Ave
- 2025 Greene Ave
- 2035 Greene Ave
- 2023 Greene Ave
- 2037 Greene Ave
- 2021 Greene Ave
- 2021 Greene Ave Unit 2
- 2021 Greene Ave
- 2039 Greene Ave
- 2028 Harmon St
- 2030 Harmon St
- 2026 Harmon St
- 2019 Greene Ave
- 2032 Harmon St
- 2024 Harmon St
- 20-17 Greene Ave